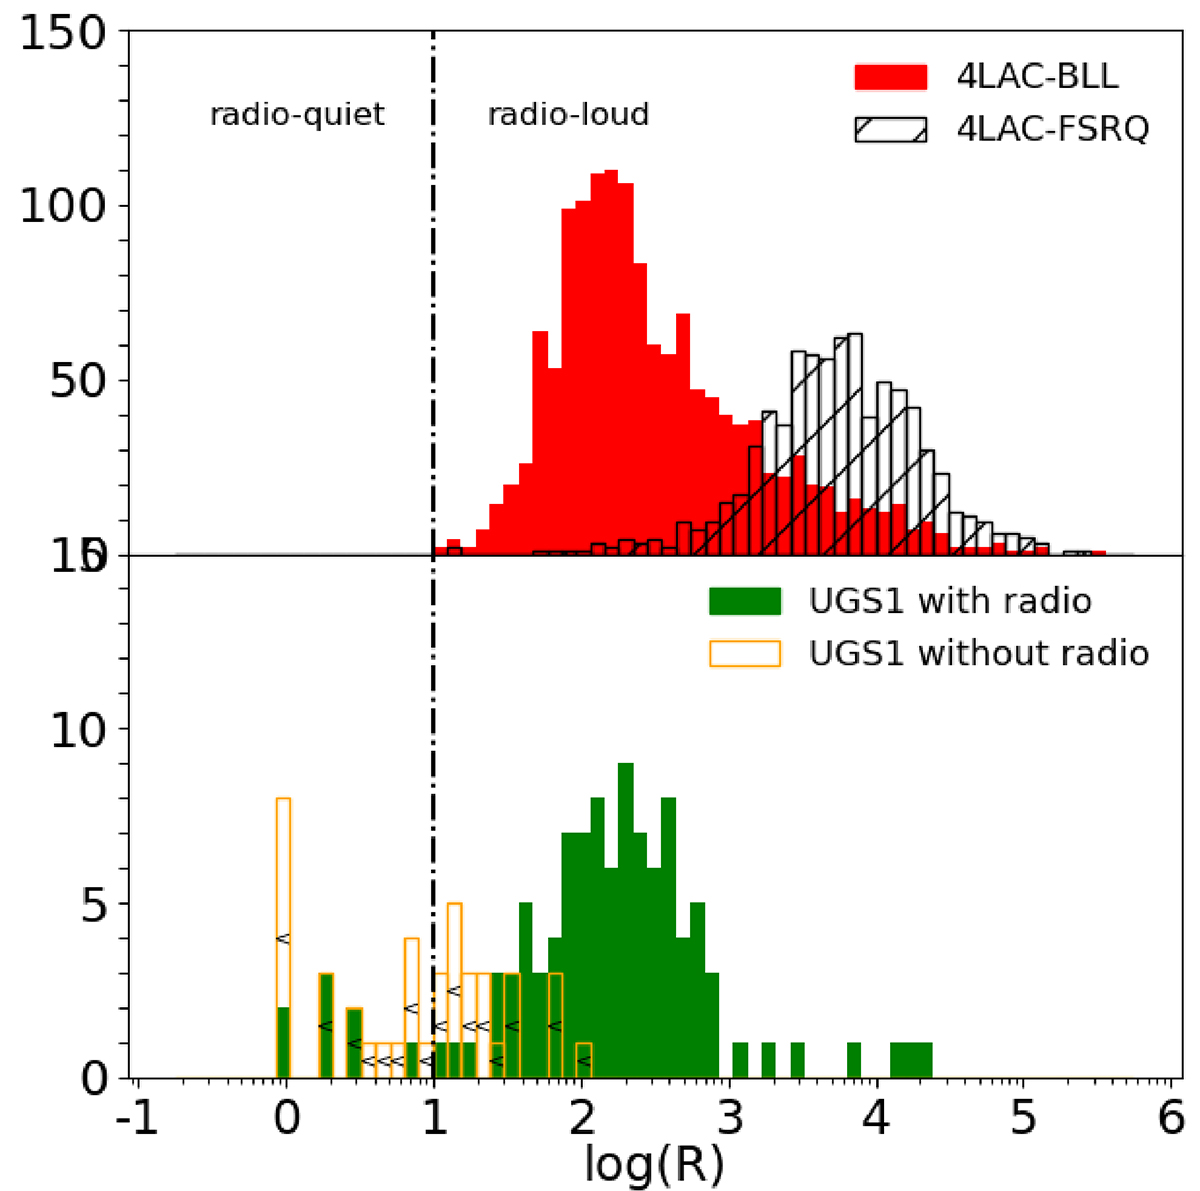
Fig. 5.
Download original image
Distribution of the radio-loudness parameter (log(R)) value for 1409 objects classified as BLL and 771 objects as FSRQ of the 4LAC catalogue (upper panel) and for the counterparts of UGS1 (lower panel). The empty orange bars represent the upper limits on R for UGS1 without a radio counterpart. The dashed vertical black line represents the radio-loudness parameter value (R = 10) that separates the radio-quiet from the radio-loud sources. Sources with proper motion are excluded from the histograms.
Current usage metrics show cumulative count of Article Views (full-text article views including HTML views, PDF and ePub downloads, according to the available data) and Abstracts Views on Vision4Press platform.
Data correspond to usage on the plateform after 2015. The current usage metrics is available 48-96 hours after online publication and is updated daily on week days.
Initial download of the metrics may take a while.