Fig. 9.
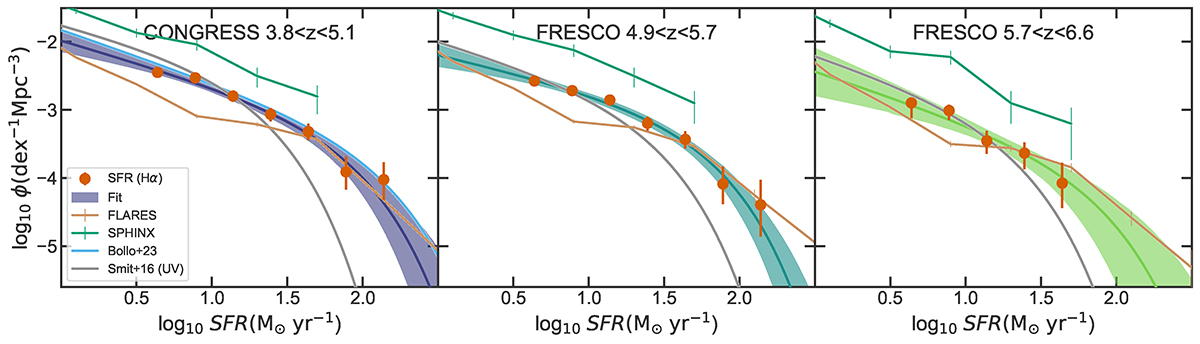
Download original image
Star formation rate functions at z = 3.8 − 6.6 split into three redshift bins. Solid circles show the number densities derived from dust-corrected Hα luminosities. Solid lines within shaded regions show the fitted Schechter functions and the 68% confidence intervals for Hα values. Also shown are the simulations results of FLARES (Lovell et al. 2021; Vijayan et al. 2021) and SPHINX (Katz et al. 2023) at z ∼ 4, z ∼ 5, and z ∼ 6; and the literature Hα-derived results from Bollo et al. (2023) at redshifts 3.86 < z < 4.94 and UV-derived from Smit et al. (2016) at z ∼ 3.8, 4.9, and 5.9 (scaled to match our Hα conversion factor).
Current usage metrics show cumulative count of Article Views (full-text article views including HTML views, PDF and ePub downloads, according to the available data) and Abstracts Views on Vision4Press platform.
Data correspond to usage on the plateform after 2015. The current usage metrics is available 48-96 hours after online publication and is updated daily on week days.
Initial download of the metrics may take a while.