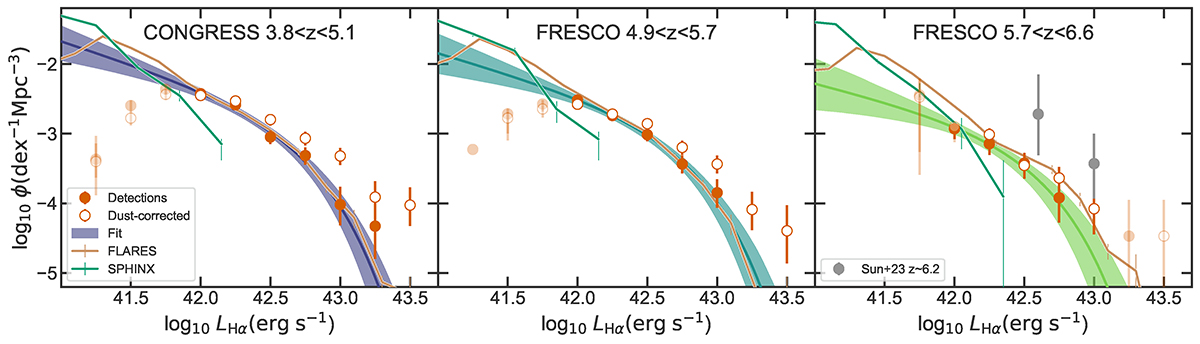
Fig. 7.
Download original image
Observed Hα luminosity function at z = 3.8 − 6.6, split in three redshift bins. Solid circles show the observed number densities, which are transparent when their average completeness is below 65% (these values are not considered for the fit). Solid lines within shaded regions show the fitted Schechter functions and the 68% confidence intervals. Also shown are the results of FLARES (Lovell et al. 2021; Vijayan et al. 2021) and SPHINX (Katz et al. 2023) at z ∼ 4, z ∼ 5, and z ∼ 6; and the results of Sun et al. (2023) at z ∼ 6.2.
Current usage metrics show cumulative count of Article Views (full-text article views including HTML views, PDF and ePub downloads, according to the available data) and Abstracts Views on Vision4Press platform.
Data correspond to usage on the plateform after 2015. The current usage metrics is available 48-96 hours after online publication and is updated daily on week days.
Initial download of the metrics may take a while.