Fig. 5.
Download original image
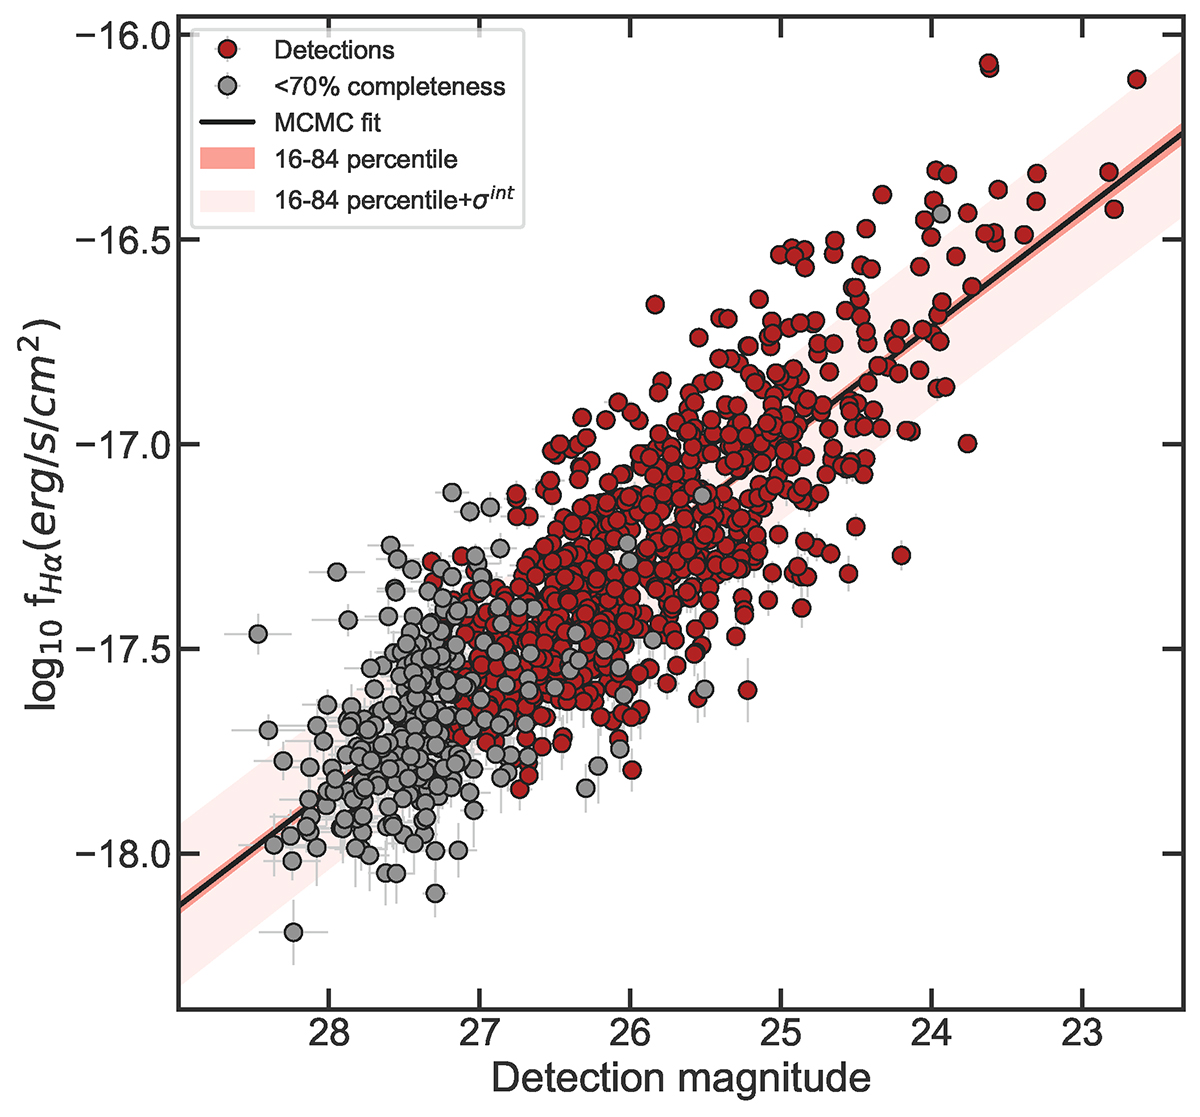
Relation between our catalog’s Hα flux and the detection magnitude (stack of F444W and F210M). The solid, black line represents a Bayesian linear fit, while the shadowed area represents the intrinsic 1σ dispersion around the mean relation. Grey, filled circles are the sources with completeness below 65%, while red circles correspond to galaxies with higher completeness. As can be seen, our catalog of Hα emitters is starting to become incomplete at ∼3 × 10⁻¹⁸ erg s−1 cm−2, where we are likely missing emitters that are not included in our parent catalog or are not extracted due to our requirements on photo-zs.
Current usage metrics show cumulative count of Article Views (full-text article views including HTML views, PDF and ePub downloads, according to the available data) and Abstracts Views on Vision4Press platform.
Data correspond to usage on the plateform after 2015. The current usage metrics is available 48-96 hours after online publication and is updated daily on week days.
Initial download of the metrics may take a while.