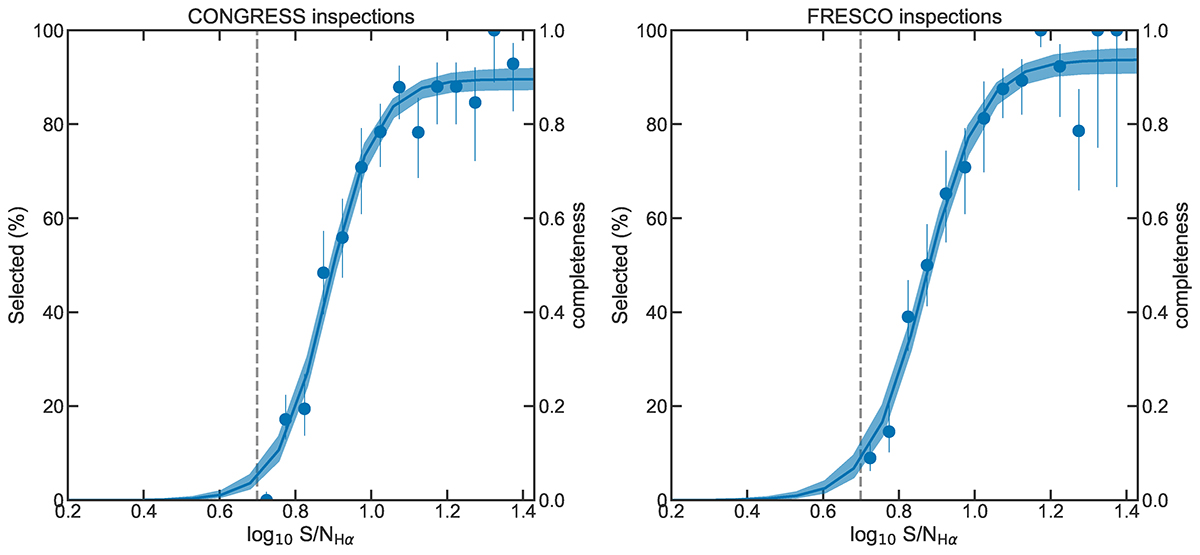
Fig. 4.
Download original image
Percentage of mock sources that were selected through visual inspection as q ≥ 1.75, in log(Hα)-flux bins. The visual inspection completeness is modeled as a sigmoid function, separately for CONGRESS (left) and FRESCO (right). The vertical dashed line marks the S/N > 5 limit. The resulting sigmoid functions are shown in Eqs. (5) and (6).
Current usage metrics show cumulative count of Article Views (full-text article views including HTML views, PDF and ePub downloads, according to the available data) and Abstracts Views on Vision4Press platform.
Data correspond to usage on the plateform after 2015. The current usage metrics is available 48-96 hours after online publication and is updated daily on week days.
Initial download of the metrics may take a while.