Open Access
Fig. B.1.
Download original image
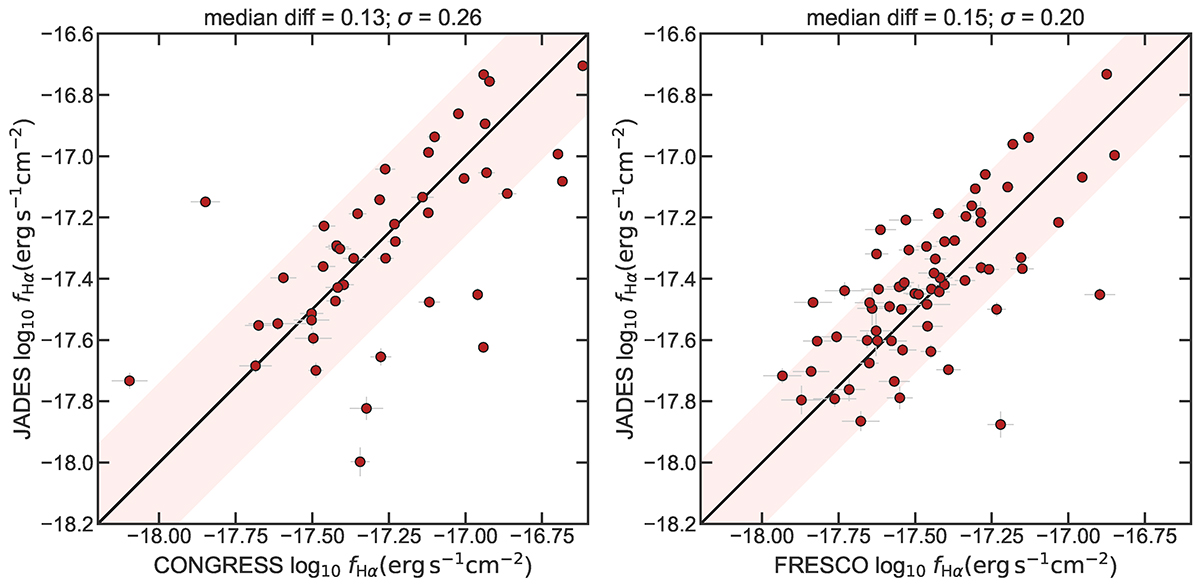
Comparison between our Hα fluxes, obtained with NIRCam/grism, and the Hα fluxes in JADES DR3 (D’Eugenio et al. 2024), obtained with NIRSpec prism. The solid lines are the 1:1 relations, while the shaded regions are the 1σ deviations. The median offsets written on top are calculated as log(fgrism/fJADES).
Current usage metrics show cumulative count of Article Views (full-text article views including HTML views, PDF and ePub downloads, according to the available data) and Abstracts Views on Vision4Press platform.
Data correspond to usage on the plateform after 2015. The current usage metrics is available 48-96 hours after online publication and is updated daily on week days.
Initial download of the metrics may take a while.