Fig. 7.
Download original image
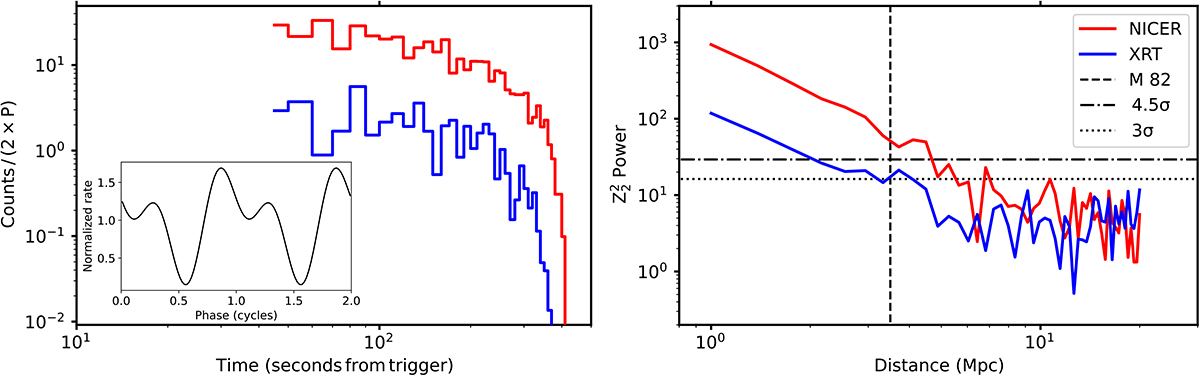
Re-pointing simulation results. Left: Simulated MGF tail light curve with XRT (blue) and NICER (red) assuming the properties as observed in the SGR 1806−20 MGF tail, and scaling it to the M82 distance of 3.5 Mpc. The inset shows the modulation that is embedded in the light curve. Right: Z22 power for pulsation detection in XRT and NICER as a function of MGF distance. The dot-dashed and the dotted lines show the 4.5σ and 3σ detection significance (single-trial), respectively. The vertical dashed line is the M82 distance of 3.5 Mpc. See the main text for more details.
Current usage metrics show cumulative count of Article Views (full-text article views including HTML views, PDF and ePub downloads, according to the available data) and Abstracts Views on Vision4Press platform.
Data correspond to usage on the plateform after 2015. The current usage metrics is available 48-96 hours after online publication and is updated daily on week days.
Initial download of the metrics may take a while.