Fig. 16
Download original image
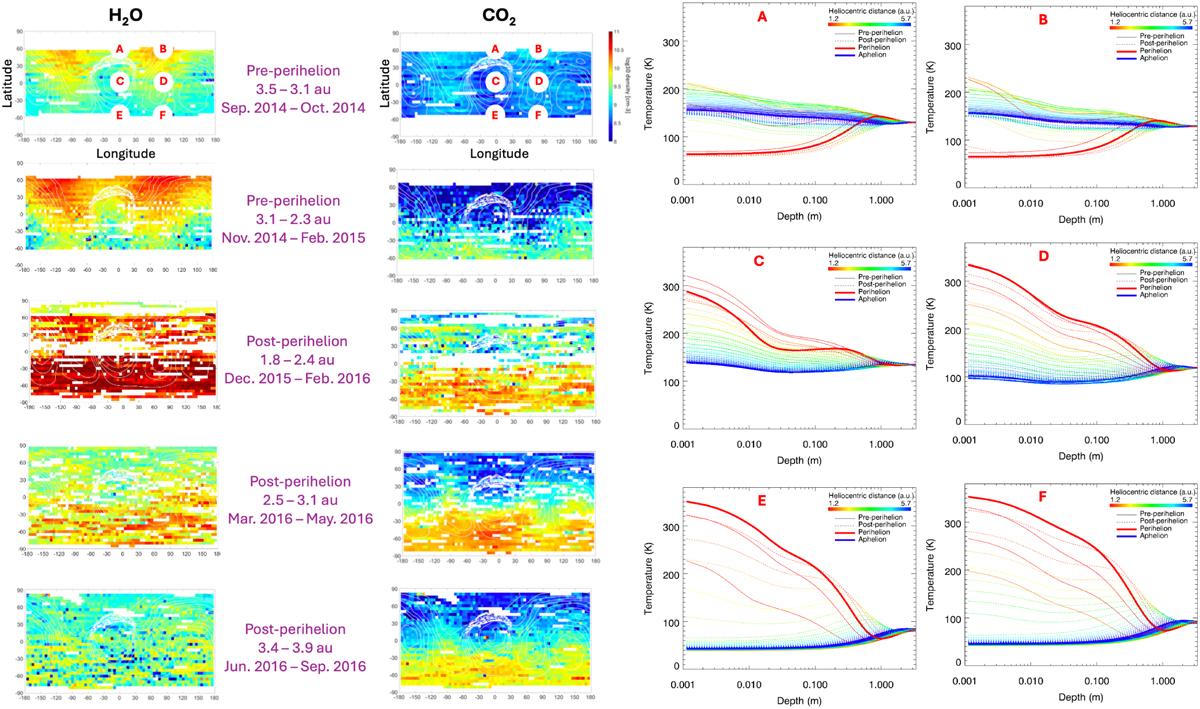
Column density maps for H2O (first column) and CO2 (second column) at different heliocentric distances, from ROSINA/RTOF observations; the figure is adapted from Hoang et al. (2019). The temperature profiles with time and depth corresponding to locations A to F on the maps, computed with Model 2, are shown in the third and fourth columns.
Current usage metrics show cumulative count of Article Views (full-text article views including HTML views, PDF and ePub downloads, according to the available data) and Abstracts Views on Vision4Press platform.
Data correspond to usage on the plateform after 2015. The current usage metrics is available 48-96 hours after online publication and is updated daily on week days.
Initial download of the metrics may take a while.