Fig. 13
Download original image
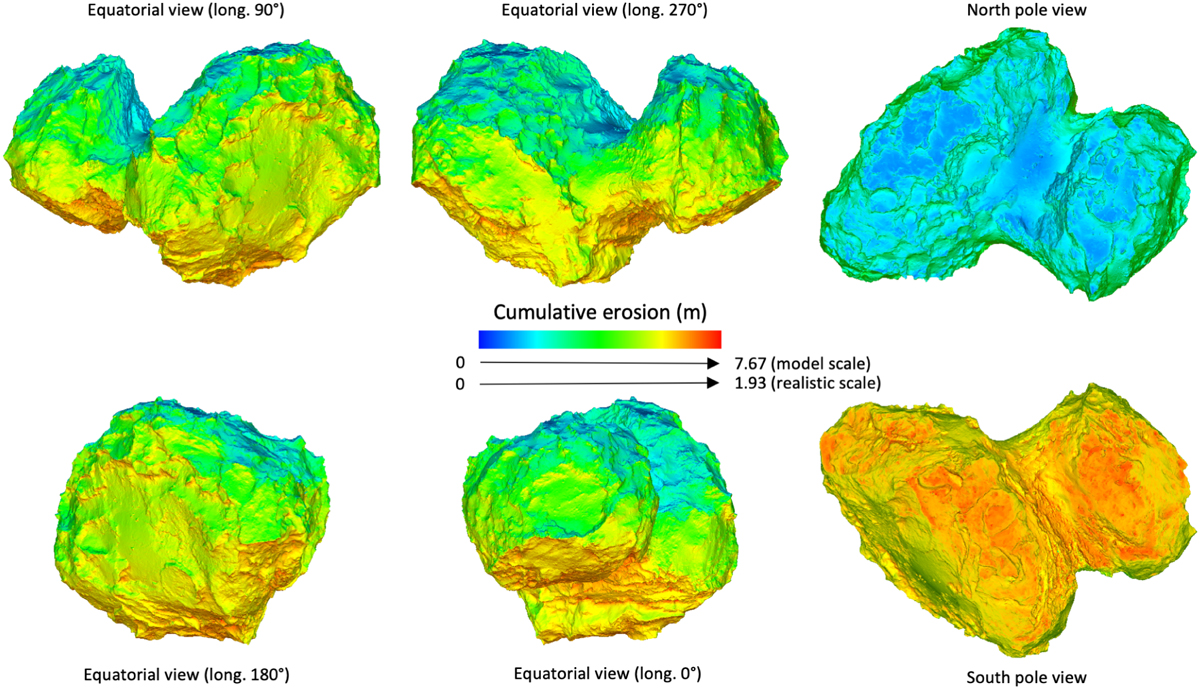
Erosion (in m) at the surface of 67P over one revolution, calculated with Model 1 assuming pure water ice (f =1 in Eq. (1)). Two scales are shown for the colour bar: one corresponding to our model with pure water ice (model scale) and one corresponding to the same model but scaled to the total mass loss derived from RSI data and OSIRIS images (realistic scale). The results were obtained with Model 1.
Current usage metrics show cumulative count of Article Views (full-text article views including HTML views, PDF and ePub downloads, according to the available data) and Abstracts Views on Vision4Press platform.
Data correspond to usage on the plateform after 2015. The current usage metrics is available 48-96 hours after online publication and is updated daily on week days.
Initial download of the metrics may take a while.