| Issue |
A&A
Volume 694, February 2025
|
|
|---|---|---|
| Article Number | A56 | |
| Number of page(s) | 15 | |
| Section | Galactic structure, stellar clusters and populations | |
| DOI | https://doi.org/10.1051/0004-6361/202452219 | |
| Published online | 31 January 2025 | |
Effects of secular growth and mergers on the evolution of metallicity gradients and azimuthal variations in a Milky Way-like galaxy
1
Observatoire Astronomique de Strasbourg, Université de Strasbourg, CNRS UMR 7550,
67000
Strasbourg,
France
2
University of Strasbourg Institute for Advanced Study,
5 allée du Général Rouvillois,
67083
Strasbourg,
France
3
Leibniz-Institut für Astrophysik Potsdam (AIP),
An der Sternwarte 16,
14482,
Potsdam,
Germany
4
Observatoire de Paris, section de Meudon, GEPI,
5 Place Jules Jannsen,
92195
Meudon,
France
5
Lund Observatory, Division of Astrophysics, Department of Physics, Lund University,
Box 43,
221 00
Lund,
Sweden
6
Department of Space, Earth and Environment, Chalmers University of Technology,
41296
Gothenburg,
Sweden
★ Corresponding author; This email address is being protected from spambots. You need JavaScript enabled to view it.
Received:
12
September
2024
Accepted:
29
October
2024
Abstract
We analyzed the evolution of the radial profiles and the azimuthal variations of the stellar metallicities from the VINTERGATAN simulation of a Milky Way-like galaxy. We find that negative gradients exist as soon as the disk settles at high redshift, and are maintained throughout the long-term evolution of the galaxy, including during major merger events. The inside-out growth of the disk and an overall outward radial migration tend to flatten these gradients in time. Major merger events only have a moderate and shortlived imprint on the [Fe/H] distributions with almost no radial dependence. The reason lies in the timescale for enrichment in Fe being significantly longer than the duration of the starbursts episodes, themselves slower than dynamical mixing during typical interactions. It results in signatures of major mergers becoming undetectable in [Fe/H] only a few megayears after pericenter passages. We note that considering other tracers like the warm interstellar medium, or monitoring the evolution of the metallicity gradient as a single value instead of a radial full profile could lead to different interpretations; we warn against oversimplifying this complex problem.
Key words: methods: numerical / Galaxy: disk / Galaxy: evolution
© The Authors 2025
 Open Access article, published by EDP Sciences, under the terms of the Creative Commons Attribution License (https://creativecommons.org/licenses/by/4.0), which permits unrestricted use, distribution, and reproduction in any medium, provided the original work is properly cited.
This article is published in open access under the Subscribe to Open model. This email address is being protected from spambots. You need JavaScript enabled to view it. to support open access publication.
1 Introduction
Chemical abundances are, in principle, one of the most insightful relics in Galactic archeology, as they freeze in time the physical conditions of the galaxies when stars formed (Tinsley 1979). However, the uncertainties on stellar ages and on the abundances themselves; the incompleteness of surveys; and the diversity of the methods, tracers, and results published greatly complicate the task of decoding this information to retrace the formation history of our Milky Way and of galaxies in general.
The method of chemical tagging attempts to retrieve the birth position of a star within its host galaxy (Freeman & Bland-Hawthorn 2002), arguing that stars formed in the same cluster (that later dissolved) or in the same region of the host galaxy share similar ages and abundances (Bland-Hawthorn et al. 2010; Ness et al. 2022). This information would then allow us to reconstruct the evolution of the galactic disk (but with mixed validity and success; see the discussions in, e.g., Ting et al. 2015; Hogg et al. 2016; Smiljanic et al. 2018; Garcia-Dias et al. 2019; Price-Jones et al. 2020; Casamiquela et al. 2021, and references therein). Chemical tagging relies on the assumptions of chemical homogeneity of a cluster’s parent gas cloud, and on the ability to distinguish between different structures with comparable (but not identical) abundances, which requires sufficiently strong time and spatial (radial and/or azimuthal) chemical variations. While the chemical homogeneity of clusters is relatively robust (e.g., Bovy et al. 2016), the validity domain of the latter assumption remains debated (Wenger et al. 2019; Kreckel et al. 2020; Ratcliffe et al. 2022). One of the quantifications of these variations is the gradient of the metallicity radial profiles across disk galaxies.
Many galaxies in the Local Universe, including the Milky Way, exhibit negative metallicity gradients (e.g., Bresolin 2007; Moustakas et al. 2010; Sánchez et al. 2014; Boeche et al. 2014; Anders et al. 2014; Donor et al. 2020), which has been connected to the inside-out growth of galactic disks (e.g., Marino et al. 2016; Belfiore et al. 2017). However, other galaxies yield flat or even positive slopes (e.g., Molina et al. 2017; Poetrodjojo et al. 2018), notably at high redshift (ɀ ≳ 1, Wuyts et al. 2016; Curti et al. 2020; Simons et al. 2021; Wang et al. 2022; Venturi et al. 2024). Interestingly, to our knowledge, no simulation reproduces positive metallicity gradients, regardless of the numerical method and subgrid physics employed (Acharyya et al. 2024). This discrepancy remains an important challenge, and highlights a critical problem in our understanding of galaxy formation.
The evolution of metallicity gradients is also a key element in establishing the history of galaxies (e.g., Minchev et al. 2018; Frankel et al. 2018; Lu et al. 2022; Ratcliffe et al. 2023; Haywood et al. 2024). For instance, Lu et al. (2022) found a steepening of the metallicity gradient in the Milky Way ≈8–11 Gyr ago, which they interpreted as a signature of the last major merger (see also Ratcliffe et al. 2023). In this context, the radial migration of stars (Sellwood & Binney 2002; Roškar et al. 2008; Minchev & Famaey 2010; Minchev et al. 2013; Monari et al. 2016; Carr et al. 2022) severely hinders the reconstruction of the metallicity gradient and its evolution, and the associated chemo-kinematical relations (Pilkington et al. 2012; Kubryk et al. 2013; Minchev et al. 2014; Anders et al. 2017; Vincenzo & Kobayashi 2020; Ratcliffe et al. 2023; Haywood et al. 2024). Strong assumptions must then be made, for example the azimuthal mixing of the interstellar medium (ISM), and the temporal and radial shapes of the metallicity distributions (Minchev et al. 2018). Numerical simulations of galaxy formation are essential in order to validate these assumptions and to help in the interpretation of the results.
Moreover, the history of galaxies cannot be restricted to an intrinsic evolution in isolation. At least during an early phase of their history, they grow by accreting external matter, either adi-abatically along intergalactic filaments or by merging with their neighbors. The external origin of this material implies different chemical compositions, and thus an alteration of the metallicity of the galaxy. On the one hand, the accretion of gas (either at close-to-pristine metallicity from lightly polluted filaments or at low metallicity from low-mass satellite galaxies that did not self-enrich as much as their massive accretors) is expected to rapidly reduce the overall abundances of the disk, as evoked in the two-infall model (Chiappini et al. 1997; Spitoni et al. 2019) to explain the observed diversity of the stellar populations in the Milky Way (e.g., Haywood et al. 2013). On the other hand, interactions and mergers are also thought to accelerate the radial mixing of the ISM and the stars, leading to flat metallicity gradients (Kewley et al. 2010; Rich et al. 2012; Muñoz-Elgueta et al. 2018). It is therefore essential to understand and characterize the effects of mergers and secular accretion on the chemical content of galaxies, and the signature(s) they leave on metallicity gradients. Here again, simulations are key to dissecting the relative impacts of the various physical processes on the metallicity distributions.
In the MUGS and MaGICC simulations, Gibson et al. (2013) noted that different subgrid recipes for stellar feedback could lead to opposite conclusions: enhanced feedback induces an efficient redistribution of gas over galactic scales, and thus relatively flat metallicity gradients, while a weaker feedback (without pre-supernova contributions in their study) allows steep gradients at high redshifts. At that time our understanding of stellar feedback and its implementation in galaxy simulations was still in the “pioneer” era, and rather than treating their study as a validation of one feedback method over the other, Gibson et al. (2013) wisely emphasized that different subgrid models of the same process could lead to a diversity of results and conclusions.
More recently, Bellardini et al. (2022) found in FIRE simulations a steepening of the metallicity gradient of young stars, which form with an initially flat gradient with important azimuthal variations that fade with cosmic time. Graf et al. (2024) complemented this study by noting an age-dependence of the gradients in these simulations. Buck et al. (2023) reported sudden (temporary) steepenings of the gradients in the warm ISM of the NIHAO-UHD simulation suite, which they attribute to the accretion of low-metallicity gas in the galactic outskirts during merger events at high redshift. The differences between the tracers used in these studies (young stars and warm gas) suggests that the underlying physical process behind the change in metallicity gradient may not be the same in both cases.
In their analysis of the FOGGIE simulations, Acharyya et al. (2024) emphasize the limitations of describing the metal distribution in galaxies with the sole value of a global gradient. For instance, they found step-shaped or more complex nonmonotonic radial distributions in [Fe/H], which would not be properly described by a single-value slope. A similar behavior has recently been identified in the present-day stellar populations of the Milky Way, of which metallicity profiles yield distinct features near bar resonances (Haywood et al. 2024). The absence of a smooth monotonous shape of the metallicity profiles hint to different processes being active in different regions of the galaxy in setting and altering the metal content. Furthermore, Acharyya et al. (2024) leveraged the high time-frequency of their simulation output to highlight rapid fluctuations of the gradients, concerning ~30 to 50% of the total time evolution of galaxies. Such rapid variations hinder the interpretation of data if or when galaxies are observed during a short nonrepresentative state, far from their average behavior.
Studying the full radial metallicity profile, rather than a single value to represent the gradient, gives us the possibility to capture potential azimuthal variations and age-specific trends, and thus appears as a necessary step toward a holistic understanding of galaxy evolution. In this paper we propose to follow this route by analyzing the high-resolution cosmological zoom-in simulation of the Milky Way-like galaxy VINTERGATAN. In the following, we use this simulation to illustrate possible variations of the metallicity distributions, and to connect them to their physical causes. Although we build our analysis on a unique formation scenario, we argue that the generalization of our conclusions could apply to a much broader range of histories, even beyond the Milky Way itself.
2 Method
We used the VINTERGATAN simulation presented in Agertz et al. (2021) and Renaud et al. (2021b,a), and summarize here the numerical technique we employed. VINTERGATAN is a cos-mological zoom-in simulation of a Milky Way-like galaxy run with the RAMSES code (Teyssier 2002) with adaptive mesh refinement down to 20 pc in the dense interstellar medium. It includes heating from an ultraviolet background, gas self-shielding, atomic and molecular cooling, and star formation at a local efficiency per free-fall time (~1% see Padoan et al. 2012) above a density threshold and below a temperature threshold of 100 cm−3 and 100 K, respectively. The stellar component is then sampled with stellar particles of masses ~5000 M⊙ (referred to as stars in the following, for simplicity). Stellar feedback encompasses injection of energy, momentum, mass, and heavy elements from winds, radiation pressure, and type II and Ia supernovae.
VINTERGATAN uses chemical yields for oxygen and iron from Woosley & Heger (2007), and we follow their independent evolutions across the simulation. Oxygen is used as a tracer for the α elements. We computed the abundance ratios of the elements X and Y as
![Mathematical equation: $[Y/X] = \log \left( {{{{f_Y}} \over {{f_X}}}{{{m_X}\,{_{ \odot ,X}}} \over {{m_Y}\,{_{ \odot ,Y}}}}} \right),$](/articles/aa/full_html/2025/02/aa52219-24/aa52219-24-eq1.png) (1)
(1)
where f is the mass fraction of the element, m is its atomic mass, and ϵ⊙ its solar abundance from (Anders & Grevesse 1989). We note that uncertainties on chemical yields in models and observations necessarily lead to mismatches between the simulated and observed values (e.g., Blancato et al. 2019; Buck et al. 2021). In VINTERGATAN, we chose to keep the raw values from the simulation rather than post-processing them (e.g., by re-normalization) based on uncertain models or observations. Therefore, we focus our analyses on the relative variation of the abundances and metal profiles, rather than on their absolute values.
The initial conditions are identical to the model m12i of Hopkins et al. (2014) and Wetzel et al. (2016), also used in Bellardini et al. (2022). However, our different numerical treatments and subgrid recipes lead to significantly different results and conclusions from these works (as discussed later). The zoom-in volume was initialized at ɀ = 100 with dark matter particles of mass 3.5 × 10⁴ M⊙, and a gas mass resolution of 7.1 × 10³ M⊙, with a gas metallicity of 10−3 Z⊙ to mimic the enrichment from unresolved population III stars. This leads to the formation of a dark matter halo of radius R200 = 3 34 kpc and virial mass M200 = 1.3 × 10¹² M⊙ at ɀ = 0. Due to numerical cost, the high-resolution hydrodynamical simulation is stopped at ɀ = 0.17, which is several billion years after that galaxy evolution became slow and secular, and thus when this last snapshot is representative of present-day conditions (Renaud et al. 2021b). The quality of the match between the simulation and observational data is discussed in Agertz et al. (2021). The absence of a bar in VINTERGATAN may affect our conclusions as strong and long-lived bars influence gas flows, orbital excitations, resonances, and radial migrations (Di Matteo et al. 2013). The strong mismatches between the bar fraction in observations and numerical simulations, and its evolution with redshift are a notorious problem in almost all cosmological simulations, which remains to be understood (see Reddish et al. 2022, Kraljic et al., in prep.).
All the following analyses are conducted in cylindrical coordinates, with a selection volume defined as the slice of height ±300 pc centered on the plane orthogonal to the angular momentum vector of the stars, and passing by their center of mass, of the most massive progenitor of the most massive galaxy at the end of the simulation. As such, we start the analysis only after the disk settling, which has been estimated at ɀ ≲ 5 by examining the ratio of rotational and dispersion velocities (see Segovia Otero et al. 2022). The growth of the galaxy is dominated by mergers with massive neighbors, until the last major merger starting at ɀ ≈ 1.2 (i.e., at a look-back time of 9 Gyr) (Renaud et al. 2021b). At later times, the galactic disk grows inside-out in a secular way, together with the alignment of the outer, tilting disk (see Renaud et al. 2021a for details).
In this paper, we use robust estimators to conduct statistical analyses on sparse datasets: the median (instead of the mean) and the robust standard deviation computed as the median absolute deviation (MAD) divided by the scale factor of the normal distribution 0.6745 (see Müller 2000; Romeo et al. 2023, for details).
We considered only the instantaneous radius of stars, and not that of their guiding centers. This has implications on the assessments of the effects of radial migration, as we discuss below. We compute the radial profiles by measuring the median metallicity in logarithmically spaced radial bins so as to have larger bins at larger radii where the density is lower. We call annulus dispersion σannulus the robust standard deviation of the metallicity of all the stars within such a radial bin {[Fe/H]R],
![Mathematical equation: ${\sigma _{{\rm{annulus }}}}(R) = {{{\mathop{\rm med}\nolimits} \left( {\left| {\left\{ {{{[{\rm{Fe}}/{\rm{H}}]}_R}} \right\} - {\mathop{\rm med}\nolimits} \left\{ {{{[{\rm{Fe}}/{\rm{H}}]}_R}} \right\}} \right|} \right)} \over {0.6745}},$](/articles/aa/full_html/2025/02/aa52219-24/aa52219-24-eq2.png) (2)
(2)
where med is the median.
To evaluate the importance of the azimuthal scatter, we split each radial annulus into angular bins of width 5°. Then we consider the metallicity of stars within this radial and angular bin, {[Fe/H]R,θ}, and measure its robust standard deviation around the median of the entire annulus:
![Mathematical equation: ${\sigma _{{\rm{azimuth }}}}(R,\theta ) = {{{\mathop{\rm med}\nolimits} \left( {\left| {\left\{ {{{[{\rm{Fe}}/{\rm{H}}]}_{R,\theta }}} \right\} - {\mathop{\rm med}\nolimits} \left\{ {{{[{\rm{Fe}}/{\rm{H}}]}_R}} \right\}} \right|} \right)} \over {0.6745}}.$](/articles/aa/full_html/2025/02/aa52219-24/aa52219-24-eq3.png) (3)
(3)
Azimuthal inhomogeneities exist if some of the values of σazimuth(R, θ) differ from σannulus(R). Therefore, we introduce the dimensionless anisotropy parameter
 (4)
(4)
This parameter is close to zero when the scatter is isotropic, and is on the order of unity when the scatter in metallicity is caused by strong azimuthal variations. We note that this parameter projects the 2D anisotropy into the radial dimension. Using a bi-dimensional anisotropy parameter (i.e., depending on both R and θ) would provide better estimates of the anisotropic nature of the systems studied, especially for large σannulus, but would also be more subject to low number statistics. For this reason, and for the sake of simplicity, we chose to use the definition of Equation (4) to estimate the level of anisotropy.
3 Results
3.1 Long-term evolution
3.1.1 The situation at different epochs
The median metallicity of all the stars contained within ±300 pc from the galactic mid-plane is mapped in Figure 1, at six epochs along the evolution of the galaxy (indicated by redshift and look-back time). A visual inspection already reveals the presence of negative radial gradients at all epochs, including the earliest. However, the azimuthal distributions are complex with fluctuations visible virtually at all radii, and with no clear trend. As stated in Section 2, a precise and robust estimate of the 2D anisotropy is a highly nontrivial task, subject to low number statistics, and we resort instead to a 1D estimate via the χ (R) parameter for the rest of the paper.
At ɀ = 2 (top right panel), the metallicity map reveals the presence of an S-shaped spiral-like structure composed of metal-rich stars ([Fe/H] ≈ 0.0) in the inner ≈2.5 kpc. These maps do not contain information on the stellar mass in each bin, and thus this shape does not necessarily correspond to a morphological structure. At this redshift, the galactic disk is too dynamically hot to host the presence of spiral arms (see Renaud et al. 2021b) likely because of the high gas fraction (Renaud et al. 2021c) and repeated tidal stirring by major mergers. Instead, the ISM is organized in a few massive clumps connected by elongated arms, but far from showing the level of the symmetry found here in metallicity. These clumps host the formation of massive clusters in an otherwise relatively smooth and featureless stellar disk. Two massive stellar clumps (~106 M⊙) in particular exist near the extremities of the S-shaped structure. It is possible that stars sharing specific origins (and thus similar kinematics, ages, and chemical content) would respond to the passage of these massive clusters to form the elongated S-shaped structure visible here. The absence of peculiar structures in the maps at other epochs indicates that it is indeed a transient feature created by a precise, and thus rare, configuration.
To quantify the spatial variations in metallicity at these six epochs, Figure 2 shows the radial profiles of the median and robust standard deviation (σannulus) of the metallicity of all the stars. (σannulus is also shown in the top panel of Figure 3.)
The earliest epochs in Figure 2 yield a steep gradient of ≈−0.1 dex kpc−1 up to about 3–4 kpc (i.e., approximately 1.5 times the galactic half-mass radius at these times). Farther away, the stellar density of the galaxy drops and the few stars beyond this radius are part of small satellites, as visible in the first maps of Figure 1. They exhibit a significantly lower [Fe/H] with an increased dispersion due to the multiplicity of their origins. At later times, stars found at large radii make the outer galaxy and tidal debris expelled during previous interactions with massive galaxies. The nonlinear shape of these distributions, especially at high redshift, reaffirms the cautionary note from Acharyya et al. (2024) that metallicity profiles are not always properly described by a global single-value gradient. A similar conclusion had been reached using VINTERGATAN by Agertz et al. (2021) who reported radial variations of the present-day metallicity gradients, and also steeper gradients for the low-[α/Fe] stars, roughly corresponding to the thin kinemat-ically cold disk. Here we add that a clear negative radial gradient in [Fe/H] is visible at all epochs and all radii, including before and during the growth phase dominated by mergers (1 ≲ ɀ ≲ 5): negative gradients are already in place at early times, and are not erased by the repeated galactic interactions. This important result is discussed further in Section 3.2.
The earliest epochs in Figure 2 yield a steep gradient of ≈−0.1 dex kpc−1 up to about 3–4 kpc (i.e., approximately 1.5 times the galactic half-mass radius of ≈2 kpc). The profiles then flatten with time and it is only after ɀ = 2 that they reach their final gradient of ≈−0.05 dex kpc−1,1 also up to about 1.5 times the corresponding half-mass radii. This convergence is likely caused by the accelerated star formation around redshift 2 (i.e., during the merger-dominated growth phase): only 15% of the final galactic stellar component is formed before ɀ = 3, while this fraction jumps to 35% and 72% at ɀ = 2 and 1, respectively, because of repeated merger-induced starbursts. This implies that the statistical weights of features in the metallicity profiles built at the earliest epochs drop when the galaxy forms many stars quickly (i.e., during starbursts). This necessarily happens after disk settling (ɀ < 5, see Segovia Otero et al. 2022) and before the formation of the bulk of the thin low-[α/Fe] disk at ɀ ≈ 1 (since the merger activity dynamically and chemically prevents the onset of the thin disk; see Renaud et al. 2021b). Unlike the early epochs, breaks and discontinuities are absent from the late radial profiles. Shallower gradients, but still negative, are found in the outer disk and even beyond (≈−0.02 dex kpc−1 at the latest times).
Figure 3 shows that the dispersion in metallicity in radial annuli σannulus fluctuates with radius at the earliest epochs, but with a moderate amplitude (≈0.2–0.3 dex on average, and 0.6 dex at maximum). However, after ɀ ≈ 1 it converges toward a rather flat profile. The anisotropy parameter x shows similar trends, indicating that the outer part of the galaxies are more prone to azimuthal variations, especially at early times. This results from the influence of the large-scale environment of the galaxy, and the slow azimuthal mixing at large radii caused by long dynamical times. Important anisotropics are found over relatively narrow radial ranges at the earliest epochs, translating the irregular morphology of the disk. These trends fade with time, in particular after the last major merger (ɀ < 1), where the scatter in metallicity in the disk is close to isotropic (χ ≪ 1) over most of the galaxy.
The convergence of the metallicity profiles and gradients (found after ɀ = 2) is more precocious than that of the annulus dispersion (σannulus) and anisotropy (χ): the scatters remain high, and with relatively high radial variations until the end of the merger phase (ɀ = 1). This is particularly pronounced in the outer galaxy, beyond the radial extent of the disk (~3–4 kpc at these epochs). The annulus dispersion only really settles in the last two epochs listed here. It monotonically increases with radius in the inner galaxy, to reach a value of ≈0.2 dex in the outer galaxy (≳5 kpc; i.e., about 90% of gaseous half-mass radius at the last epochs). These results suggest that, while interactions and mergers do not destroy pre-existing metallicity gradients, they still play an important role in maintaining chemical inhomogeneities across the galactic disks, as explored in Section 3.2.
In Figures 4 and 5 we repeat this analysis, but only for stars younger than 100 Myr at each of our six epochs. This naturally strongly limits the impacts of migration of stars from their birth radii (blurring, and churning, including by tidal ejection), and confirms the conclusions presented above. In the radial range where the young and evolved populations overlap, the metallicity of the young stars is, not surprisingly, higher than that of the evolved populations, but only before ɀ = 1. Later, stars form on average with a lower metallicity than the average of the evolved populations at the same radius. This is due to two distinct effects. First, in VlNTERGATAN, the highest metallicity is reached during the last major merger at ɀ = 1.5; the distribution of [Fe/H] reaches a maximum of ≈0.7 dex. This maximum then slightly decreases to 0.5 dex because of the accretion of low-metallicity gas at the time of the first pericenter of the last major merger2. Second, the absence of mergers at these late epochs facilitates galactic-wide, secular, outward radial migration. The pre-existence of a negative metallicity gradient implies that the migration of metal-rich stars from the inner regions raises the metallicity of the full population at larger radii (compared to the young stars), accompanying the inside-out growth of the disk.
Perhaps not surprisingly, Figure 5 shows that the annulus dispersion of the young stars is significantly lower than that of the evolved populations (by factors of ≈5 – 10 on average), as a direct consequence of the more restrictive selection criterion of coeval stars. However, the anisotropy is virtually always higher for the young stars. These variations underline differences in the efficiency of chemical mixing in the cold ISM (traced here by young stars) and in the evolved stellar populations, and different degrees of dynamical coupling between the two components.
The largest anisotropies are found at intermediate radii (i.e., neither in the center-most region nor in the outer disk), where the ISM is sufficiently dense to form stars, but not perfectly azimuthally mixed. The strongest anisotropies are found at the late epochs at radii ≈3 – 8 kpc because of the stochasticity of the star formation activity (<l0 M⊙ yr−1 over the entire disk) and possibly also because of the reduced turbulence at this late stage of the disk evolution. The small number of stars concerned (compared to the full disk population) implies that this anisotropy in the young stars does not leave a strong imprint on that of the total population (Figure 3).
The opposite situation is found in the inner galaxy (≲2 kpc), with a high anisotropy early on that decreases at the late epochs: χ goes from 2–3 to 1–1.5 after ɀ = 1. In addition, the annulus dispersion is the highest in this region at all times (except localized stochastic peaks). This contrasts with the increase in the dispersion with radius noted for all the stars. The short dynamical timescale (crossing time and orbital time) near the galactic center allows the efficient mixing of the evolved populations. However, this effect remains too slow to strongly affect the young stars, which then yield their maximum dispersions in metals in the most active star-forming volumes, that is in the dense inner galaxy. Particularly at the early epochs, the central region hosts the shortest depletion times of the star-forming gas of the entire galaxy (down to ~ 100 Myr, compared to ~1 Gyr at larger radii). The elevated and complex behavior of the anisotropy parameter there suggests that the large-scale dynamics (on a kiloparsec scale) are not sufficiently rapid to mix radially and azimuthally the chemical features driven by strongly active and localized star-forming regions3.
At later times, the high dispersion but relatively moderate anisotropy suggest that the orbital mixing (kiloparsec scale) is more efficient than the turbulent mixing (local) of the ISM.
Furthermore, the slowing down of the star formation activity (lower SFR and longer depletion time) now allows for an efficient mixing of star-forming gas, which thus tends to homogenize the metallicities of the young stellar populations.
While APOGEE (DR17, Abdurro’uf et al. 2022) claims resolutions of 0.02 dex for the disk stars, other spectroscopic surveys such as GALAH (DR3, Buder et al. 2021) report uncertainties of ~0.1 dex. Recently, Hawkins (2023) and Hackshaw et al. (2024) mentioned azimuthal variations in [Fe/H] of ~0.1 dex (without age selection). Therefore, the annulus dispersions in [Fe/H] of ≈0.3 dex (all stars) and ≈0.05 dex (young stars only) that we found are close to the current observational limits. This means that at least some of the features of the radial and azimuthal distributions predicted by VIN TE RGATA N will not be found before the next generation of surveys.
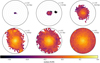 |
Fig. 1 Maps of the median metallicity of all the stars in the radial and azimuthal bins described in Section 2, at the six epochs analyzed in this paper. To ease the comparison between epochs, the color scale is identical for all panels. The radial range covered is 18 kpc, with grid lines in gray every 2.5 kpc. |
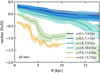 |
Fig. 2 Radial profiles of the metallicity of all the stars, measured at different epochs (indicated by their redshifts and look-back times; see legend) as the median in logarithmically spaced radial bins. The shaded areas show the robust standard deviation σannulus in each radial bin (Equation (2)). |
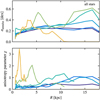 |
Fig. 3 Top: robust standard deviation of the metallicity in logarithmically spaced radial bins. Bottom: Anisotropy parameter (Equation (4)) quantifying the importance of azimuthal variations in the scatter of metallicity at a given radius. A valuer χ ≈ 0 indicates an isotropic scatter. The colors are as in Figure 2. The differences in the radial extents of the two quantities are caused by low number statistics in the outer galaxy, which forbids the azimuthal binning necessary to compute χ. |
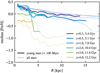 |
Fig. 4 Radial profiles of the metallicity of the young stars only. The profiles for all the stars are reproduced from Figure 2 with thin lines, for reference. |
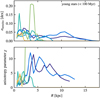 |
Fig. 5 Same as Figure 3, but only for the young stars. The ranges of the vertical axes are not the same as in Figure 3. The colors are as in Figures 2, 3, and 4. |
3.1.2 Nature versus nurture
In this section, we establish the relative roles of the conditions at birth and of the dynamical evolution on the metallicity profiles (i.e., nature versus nurture). This is done by selecting young stars formed at different epochs in the galaxy, and tracking them to subsequent times (instead of selecting a new set of young stars from each snapshot, as described in the previous section). Figure 6 shows the distributions of these (quasi) mono-age populations at birth, selected within ±300 pc from the galactic mid-plane, and with an age <100 Myr (filled contours), and then tracked at different stages of the galactic evolution (line contours of the same color in other panels).
Before the last major merger (ɀ ≳ 1), young stars are confined within a few kiloparsecs, but tend to move outward (on average) as they age. However, only a small fraction of the preexisting stars reach much larger radii, as shown by the absence of significant radial extent of the highest-level contour lines. (The half-mass radius does not significantly vary before the last major merger at ɀ ≈ 1, see Figure 6 in Agertz et al. 2021.) Therefore, at these early epochs, the radial growth of the thick disk only concerns a few aged stars, and not the young population. Nevertheless, this induces chemical mixing as stars formed in the inner regions can later be found at larger radii. The main inside-out growth of the galaxy occurs after the last major merger, together with the onset of the thin disk (at low [a/Fe]), and the alignment of the outer, tilting disk (see Renaud et al. 2021a, for details).
The migration rates of the populations are quantified in Figure 7. We computed this quantity for every star as the difference between its galactic radius at a given epoch and its birth radius, divided by the time difference between the two epochs. We then computed the median of this rate in radial bins. For this paper we used the instantaneous radius rather than that of the guiding center. As such, our measurements encompasses two effects that modify the galactic radius of stars: blurring (elliptical motions around the guiding center) and churning (increase in the average orbital radius). These effects have different physical causes and respond differently to galactic and environmental effects, such as bars and mergers exciting orbits. However, distinguishing between them is beyond the scope of this paper.
At a given epoch (panel), Figure 7 shows at which rate a given mono-age population (color) has migrated to its current radius (x-axis) since its formation. The median migration is only inward (negative rate) at the last epoch in the innermost 1.5 kpc for the population formed at ɀ = 0.3 where inward migration reaches −0.2 kpc Gyr−1. Everywhere else and at all the other epochs, the median migration is outward, with a rate that decreases as the population ages. Furthermore, at a given radius, the migration rate decreases with cosmic time for all the populations. There is no clear evidence of a change of migration regime after the last major merger (ɀ = 1), suggesting again a moderate role of mergers in the internal dynamics of pre-existing populations, as opposed to the evident and sudden inside-out expansion of star formation shortly after the last major merger ɀ = 1.
A direct consequence of the almost ubiquitous outward migration is the reduction of the steepness of the metallicity gradients, also visible in Figure A.1. The metallicity gradients of all the populations at all epochs are either negative or very weak (d[Fe/H]/ dR ≲ 0). For the populations of stars formed in the first four epochs (ɀ ≥ 1), the gradient is negative only in the initial measurement, and null after. This indicates a prompt radial mixing of these populations. However, the stars formed at later times (last two panels of Figure 6) still yield a negative gradient after some evolution. These stars form in the thin disk after the last major merger, and as such experience a less efficient, or at least less rapid, radial mixing. This is also visible in Figure 7: the migration rate of the young populations slows down with cosmic time (e.g., the blue curve in the bottom panel is shallower than the orange line in the top panel). The initial gradients tend to be steeper at low redshift, which also contributes to delaying the flattening of the distributions at late times.
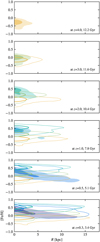 |
Fig. 6 Radial distributions of [Fe/H] of stars formed at different epochs. Each panel corresponds to one epoch, as indicated in the lower right corner. The filled contours show the distributions of young stars (<100 Myr) formed at this epoch, with levels corresponding to 0.01 and 1% of the stellar population. These stars are then tracked to the following epochs, and their evolved distributions are shown in the subsequent panels with line contours, but always keeping the same color across all panels. |
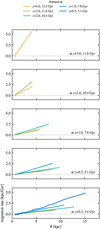 |
Fig. 7 Median radial migration rate of stars. As in Figure 6, each color corresponds to a population of stars, followed at different epochs (different panels). The quantity plotted is the median of the difference between the radius at the given epoch (the quantity on the x-axis) and the birth radius, divided by the time difference between the two epochs, with the convention of a positive value for an outward migration. By considering the instantaneous radius (instead of the average), the migration measured here includes both the blurring and churning effects. |
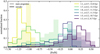 |
Fig. 8 Distributions in [Fe/H] of all the stars in the galaxies involved in the six major merger events in VINTERGATAN. The distributions are normalized by the total stellar mass of the galaxies. Each color represents a merger event; the mass ratio, redshift, and look-back time are indicated in the top right corner. At ɀ = 2.7 two distinct events cannot be separated by the time resolution of the simulation outputs, and are thus labeled with the same redshift. The [Fe/H] distributions of VINTERGATAN (i.e., the most massive Milky Way-like progenitor) at the epochs of the mergers are shown with the filled histogram, for comparison with that of its companion galaxies (solid lines). |
3.2 Evolution during the last major merger
As any other aspect of the galaxy, the distribution of metals is affected by the long-term secular evolution and more punctual and violent events such as mergers. For reference, the merger tree of VINTERGATAN, computed using the stellar component, is shown in Figure B.1. The stochastic nature of mergers and the merger history of the galaxy make it difficult to identify their precise imprint on present-day properties. This is illustrated by the overlap of the metallicity distribution in the progenitor galaxies involved in a major merger (mass ratio >1:10) shown inFigure 8. At each merger event, the main galaxy yields a higher maximum metallicity than its lower-mass companion galaxies as a result of its greater ability to produce and retain metals. For similar reasons, the metal distribution of the main galaxy is systematically wider, reflecting a longer and/or richer formation history. However, by considering galaxies with similar masses (mass ratio >1:10 in our definition), the differences in the metal content between the two progenitors of mergers remain within a fraction of dex in all cases. This already suggests that a major merger is unlikely to trigger a drastic change in the metal content of the main progenitor. Naturally, the opposite situation occurs during minor mergers where the intruder galaxy usually yields significantly poorer metal content, but the lower mass involved implies a mild contribution to the mass budget of the main, and thus also a limited change in the overall metal content of the main galaxy.
Keeping these considerations in mind, we present below the effects of major mergers on the pre-existing distributions of metals, and their gradients. To help the interpretation of the simulation data, we focus here on the transformations in the metal distributions caused by the last major merger experienced by VINTERGATAN. The first passage starts at a look-back time of 8.61 Gyr (i.e., ɀ = 1.22), involving an interloper galaxy of stellar mass of 1.0 × 10¹⁰ M⊙ (i.e., one-third of VINTERGATAN at this epoch, a gas mass of 3.2 × 10⁹ M⊙, and a gas metallicity of [Fe/H] ≈ −0.2–0.6 dex. Just before the interaction, both galaxies form stars with [Fe/H] ≈ 0–0.5 dex, and the half-mass radius of the gaseous component of VINTERGATAN is 3 kpc (Agertz et al. 2021; Renaud et al. 2021b). We chose to focus on the last major merger only, as other mergers are closer to each other in time, and their effects could be blended together, making the interpretation more involved.
Figure 9 shows the evolution of the in situ star formation rate (SFR) around the epoch of the last major merger (i.e., the star formation history of the stars formed exclusively in the most massive progenitor of the most massive galaxy at the end of the simulation), and its radial distribution. The first passage triggers a spatially extended burst of star formation, up to ≈ 8 kpc, and mainly at radii of ≈ 2–3 kpc. During the later stages of the merger and in particular at final coalescence, the boost in SFR is significantly milder, and much more radially concentrated. This concentration is caused by radial gaseous inflows becoming prominent when tidal torques dominate over other triggering mechanisms (i.e., for short separations between the galaxies) (Keel et al. 1985). The processes of shocks and tidal and turbulence compressions, which are also known to enhance star formation in mergers and explain off-nuclear starbursts, are generally shorter-lived than the time resolution adopted here (Renaud et al. 2014, 2019). Therefore, it is possible that their effects are not fully sampled in the radial distributions of Figure 9. The weaker boost in the SFR after the merger than at the first passage could be caused by a partial quenching induced by the interaction (however without feedback from an active galactic nucleus; Petersson et al. 2023), and notably in the outer galaxy (Moreno et al. 2019), and/or by the long-term depletion of the gas reservoir over timescales of several gigayears (see Renaud et al. 2021b). The exact reason is beyond the scope of the present paper.
Overall, the interaction induces two competing effects on the metal content: the boost in chemical enrichment caused by the starburst activity, and the mixing of the ISM with metal-poor gas from the interloper itself, and also from the circumgalactic medium of the two galaxies (Olivares et al. 2022). Each effect comes with a time delay with respect to the merger event itself. On the one hand, the intrinsic enrichment is delayed by the timescale of stellar evolution needed to produce and release heavy elements such as Fe4. followed by the time needed for these ejecta to form the next generation of stars. On the other hand, the diffuse metal-poor gas also takes time to condense (via thermal and dynamical instabilities) and mix with the starforming phase of the ISM (in a fashion similar to the evolution described in Semenov et al. 2017). Estimating these delays is a complicated task, and is probably highly dependent on the details of the interaction. We focus here on their combined effects, which is the net chemical evolution throughout the merger.
Figure 10 (respectively 11) shows the evolution of the radial metallicity profiles of all the stars (respectively the newly formed stars, younger than 100 Myr) before, during, and after the last major merger. The profiles of annulus dispersions and anisotropy parameters are shown in Figure 12 and 13. Thanks to the time sampling and volume selection, the stars from the interloper galaxy are only accounted for after the coalescence of the two galaxies, and do not contaminate the measurements in the stages of interaction. For the sake of readability and to enhance the visibility of the variations, a pre-merger reference radial profile computed as a stack of the first three snapshots used here is subtracted from all the profiles.
Figure 10 shows that the metallicity of the entire stellar population increases gradually and almost independently of radius during the merger event. In other words, the major merger does not induce, reinforce, or weaken metallicity gradients, as suggested in the previous sections and in contrast to the conclusions of Buck et al. (2023, see Section 4.3 for an interpretation of these differences). The notable exception is during the first pericenter passage: the metallicity drops in the inner ≈1 kpc, peaks at ≈3 kpc, and remains elevated for ≈3–10 kpc (i.e., in the outer galaxy; at this epoch, the half-mass radius of the galaxy is 2–3 kpc; Agertz et al. 2021). Interestingly, this is visible in one snapshot only, indicating that dynamical mixing smooths out these radial variations within less than 2 × 150 Myr = 300 Myr. Later, during the separation phase, we note a mild inflection of the metallicity profile near 3 kpc. This approximately corresponds to the co-rotation radius of the interaction (i.e., the radius at which the circular velocity of the main galaxy equals the orbital velocity of the interloper5). Due to gravitational torques, galactic matter tends to migrate inward inside this radius, and outward otherwise, which explains why the metallicity radial profiles yield an inflection caused by different mixing near this radius. This fades after coalescence, once the tidal torques cease. Interestingly, the violent collision at final coalescence does not yield a change that is as dramatic as for the first passage. No particular radius exhibits strong variations, probably because of efficient mixing across the disk caused by the rapid and direct impact of the interloper after it has lost its orbital angular momentum.
During the entire interaction episode, the metallicity is globally raised by 0.15 dex, that is ≈0.08 dex Gyr−1, except in the innermost region. This rate of enrichment is comparable to that found in the late stages of galaxy evolution (ɀ ≲ 2.5, before 11 Gyr ago; see Renaud et al. 2021b, their Figure 4), but significantly weaker than that in the early phase of rapid galactic growth where it can be as fast as 1.8 dex Gyr−1. Overall, despite enhancements of the SFR by factors of up to 4, the last major merger does not significantly alter the rate of enrichment in [Fe/H] across the galaxy. As suggested above, this apparent discrepancy between a starburst activity and an only mild enrichment could be explained by a time delay and/or the accumulation of low-metallicity gas of circumgalactic or intergalactic origin (see, e.g., Renaud et al. 2019).
Because old stars are included in Figure 10, these profiles gather changes due to the formation during the starburst episodes and the dynamical mixing of the pre-existing stars. To distinguish between the two effects, Figure 11 shows the same measurements, but only considering the stars younger than 100 Myr at the times of the respective snapshots. Here again, the most important enrichment with respect to the pre-merger reference occurs during the interaction phase, near the co-rotation radius (≈2.5 kpc). At virtually all stages, the enrichment at large radius (≳4 kpc) is slower than in the inner regions, confirming the dilution of the ISM by low-metallicity gas of circumgalactic or intergalactic origin, and the partial dispersal of previously enriched gas outside the co-rotation radius.
Figure 12 and 13 show that the merger tends to homogenize the metallicity in the inner galaxy (≲2.5 kpc), and slightly increase the dispersion in the outer regions. Significant anisotropic features are only visible at the first passage and coalescence (thick lines). When considering all the stars, the anisotropy peaks at the co-rotation (≈2.5 kpc), likely induced by tidal torques from the interloper, and also well beyond the half-mass radius (≳6–10 kpc) corresponding to the ejection of tidal tails made of disk stars in the otherwise metal-poor galactic outskirts. The anisotropy in the metallicity is much stronger for the young stars, especially during the peaks of the SFR (Figure 13). However, the timescale of the starburst episodes (~100–300 Myr) is significantly shorter than that of enrichment in Fe (~1 Gyr on average; e.g., Matteucci & Recchi 2001), and thus the enhanced star formation cannot leave an immediate imprint on the Fe content. This conclusion does not necessarily apply to other chemical elements with shorter production and release timescales, such as α, which can effectively trace starburst episodes (see, e.g., Renaud et al. 2021b and our conclusion below).
Furthermore, these anisotropic features can only be detected in one or two consecutive snapshots (i.e., for less than ~300 Myr). Since considering all the stars yields comparable timescales, the fading of anisotropy must be caused by efficient dynamical mixing equally affecting the young and old populations. Interestingly, a timescale of 300 Myr approximately corresponds to the revolution period of the disk, suggesting that tides from the satellite galaxy could swipe the entire disk over this period, and erase the azimuthal variations in metallicity. This confirms the findings of Renaud et al. (2019) that the short timescales involved during merger-induced starbursts imply a rapid displacement of the star-forming volumes across the galactic disks. Therefore, the increased anisotropy at the peaks of SFR is most likely caused by dynamical effects connected to the morphological transformation from tides and the impact of the interloper, rather than enrichment at a specific epoch and position.
In Section 3.1.1, we describe a drop in the azimuthal variations in [Fe/H] after the end of the merger phase, and suggest that interactions could maintain chemical inhomogeneities across the disk. The more detailed approach here complements this result by adding that it is not caused by a single interaction nor by the starburst activity. Moderate changes in the dispersion and their rapid decrease rather suggest a limited role of mergers in setting inhomogeneities. We propose that this transition at ɀ ≲ 1 is instead mainly driven by internal intrinsic factors, possibly the slowing down of the global enrichment rate and/or the morphological change in the star-forming structures set by the lowering of the gas fraction (Renaud et al. 2021c). Other simulations covering a range of formation scenarios are needed to test these hypotheses.
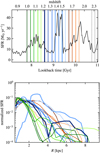 |
Fig. 9 Top: in situ SFR around the epoch of the last major merger. The colored solid vertical lines indicate the snapshots studied in Section 3.2. These snapshots are sorted into three groups: pre-merger (orange); interaction, separation, and merger (blue); and post-merger (green). The thick lines indicate the first and second (last) pericenter passages. The dotted lines mark the two pericenter passages of the previous major merger. Bottom: radial distribution of the SFR, normalized to the total SFR at these epochs, and smoothed for the sake of readability. |
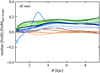 |
Fig. 10 Variations in the radial profiles of metallicity for all the stars at the instants marked in Figure 9, i.e., approximately every 150 Myr around the epoch of the last major merger. A pre-merger reference profile is computed by stacking the data from the first three snapshots shown here, and then subtracted from all the profiles to show the relative variations. |
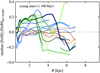 |
Fig. 11 Same as Figure 10, but only for the newly formed stars, i.e., formed less than 100 Myr before each snapshot. |
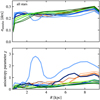 |
Fig. 12 Radial profiles of the annulus dispersion and anisotropy parameter for all the stars around the epoch of the last major merger. These quantities correspond to the median profiles in Figure 10. |
4 Discussion
4.1 Robustness to variations of the merger history
Our results are derived from a single galactic formation history, and a single merger event. As such, one can question the range of their validity across all plausible formation scenarios for Milky Way-like galaxies. However, VINTERGATAN experiences six major mergers, naturally with different orbital and intrinsic parameters (e.g., mass ratio, orbital inclination, spin-orbit coupling), and we found very little effect on the long-term evolution of metallicity distributions over the merger-dominated growth phase. This implies that our conclusions are robust against a change in the merger history of the galaxy. However, in VINTERGATAN, the last major merger occurs just before the onset of the thin disk: in our scenario, it is indeed the cessation of the merger activity that allows the geometrical, kinematical, and chemical onset of the thin, dynamically cold, and low-[ɑ/Fe] disk (Renaud et al. 2021b). While this scenario is compatible with spectroscopic data in the Milky Way (see, e.g., Ciucă et al. 2021), one could question what effect a late major merger occurring after the onset of the thin disk would have on the metal distributions. Extrapolating from our conclusions, it is possible that radial migration to large radii would then already be in place in an early thin disk when the last major merger occurs. In these outer regions, interactions are significantly more disruptive, and the timescales are longer than those we describe above. Therefore, it is possible that an interaction with a pre-existing extended disk would imprint stronger dispersions in the outer galaxy, and that such dispersions would survive for longer than the few 100 Myr we found in the present study. In the Milky Way, the last major merger is thought to have happened 8–10 Gyr ago (Nissen & Schuster 2010; Ruchti et al. 2015; Haywood et al. 2018; Helmi et al. 2018; Belokurov et al. 2018), and it is thus very unlikely that the direct signature(s) of its disruption of the metallicity radial profiles could be still detected today.
4.2 Absence of a galactic bar
VINTERGATAN does not yield a galactic bar or an AGN. This probably affects the (re-)distributions of metals in the galactic center caused by resonances and AGN feedback (see, e.g., the recent study of Verwilghen et al. 2024 based on simulations of PHANGS galaxies). Observations reveal that the fraction of strong bars in disk galaxies rapidly decreases with increasing redshift, and seems to level at only ≈5–15% at ɀ ~ 1–2 (see, e.g., Melvin et al. 2014 and references therein, and an update from JWST in Le Conte et al. 2024 at high redshift). If these statistics are representative of the history of the Milky Way, this would suggest that its bar probably did not form before the last major merger (see, e.g., Haywood et al. 2024), and thus only had a late effect on the metal distributions, confined to the secular growth phase of the Galaxy. By increasing radial migration, a bar would make the metal gradients shallower. In addition, the resonances it creates could induce detectable features such as breaks in the metallicity profiles, as predicted by Khoperskov et al. (2020) and found by Haywood et al. (2024). It is also possible that a bar would dynamically increase the azimuthal dispersions, notably in the older populations experiencing streaming motions from non-axisymmetric structures (Di Matteo et al. 2013; Grand et al. 2016; Orr et al. 2023). Testing these hypotheses requires cosmological simulations that reproduce the bar strength and its correct evolution across cosmic time, which seems to be a challenge for modern simulations (Reddish et al. 2022, but see also Fragkoudi et al. 2020).
4.3 Comparisons with other simulations
Examining the young stellar populations in the FIRE simulations, Bellardini et al. (2022) reported that the gradients in [Fe/H] steepen with time after being initially flat. In Figures 4 and 6, we also see that the radial distribution in [Fe/H] for the young stars remains almost flat until ɀ ≈ 2. It is only after the rapid enrichment phase of the galaxy that the star formation activity is concentrated in the galactic center, leading to a more rapid increase in the metallicity there than in the outskirts, and thus to a negative gradient in [Fe/H] for the young stars. Our results then confirm the findings of Bellardini et al. (2022). We add that, by including evolved populations, we find that outward motions (migration and tidal effects) naturally stretch the metal distributions with time, which necessarily flattens the gradients for the entire population.
In the NIHAO-UHD simulations, Buck et al. (2023) found that massive mergers induce a steepening of the metallicity gradients. However, our analysis concludes that mergers do not have long-lasting effects on pre-existing gradients. This apparent discrepancy is likely caused by the different approaches we followed. Buck et al. (2023) monitor the metallicity of the gas below 1.5 × 10⁴ K, while we considered the [Fe/H] abundance of stars. Our analysis restricted to the young stellar populations can be connected to the star-forming gas, but important differences remain between the warm ISM (as considered in Buck et al. 2023) and the cold star-forming phase (<100 K in our prescription). This is particularly relevant in the low-density regions of the galactic outskirts where the cooling times are long (Birnboim & Dekel 2003), and precisely where Buck et al. (2023) found that mergers deposit the low-metallicity gas, which causes the steepening of their gradients. Therefore, before this gas becomes cold and dense enough to form stars, it is possible that it would have mixed with more metal-rich material in the inner disk. The resulting effect on the metallicity gradient of the young stars would then be much less pronounced than that noted by Buck et al. (2023) in the warm ISM, as predicted by our results. In addition, we note that the steepening of the gradients measured in Buck et al. (2023, see their Figure 2) at the times of mergers are short-lived (a few 100 Myr), and that the long-term evolution of their galaxies instead tends to yield a flattening of the metallicity profiles, as we also find here.
5 Summary and conclusion
Using the VINTERGATAN cosmological zoom-in simulation of a Milky Way-like galaxy, we studied the emergence and evolution of stellar metallicity radial distributions in the galactic disk, their gradients, and their dispersion across cosmic time. Our main results are as follows:
Negative metallicity gradients are present as soon as the disk settles, and are preserved during the various interactions and mergers the galaxy experiences;
Significant azimuthal variations of the metallicities are the most pronounced in the outer regions of the galaxy and at early epochs. They disappear after the last major merger;
The median radial migration (blurring and churning) is outward at all epochs, except in the central ≈1.5 kpc of the disk. This migration induces a flattening of the metallicity gradients of mono-age populations with time;
The final shape of the metallicity profile of the entire stellar population is reached at ɀ = 2, even before the last major merger.
Young stars exhibit an almost flat metallicity gradient at high redshift. It steepens at later times when the galactic center enriches more quickly than the outskirts;
The migration rate of young stars decreases with time. Moreover, the migration of a given mono-age population also slows down as it ages.
Major mergers do not induce, reinforce, or weaken any metallicity gradient;
The metallicity of the entire stellar population gradually increases with time during a major merger, with only weak radial dependences. These are short-lived moderate variations in [Fe/H] in the galactic center (due to tidal-driven inflows) and in the outer galaxy (more sensitive to tidal effects and chemical pollution). The orbital co-rotation radius marks a transition zone;
The short-lived nature of these variations in [Fe/H] implies that they are not caused by the chemical enrichment from starburst events, but rather by the dynamics of the interaction;
Short-lived azimuthal variations in the metallicity profiles are detected after the pericenter passages. Fast azimuthal and radial mixing induced by the interaction erase them in about one rotation period of the disk (~300 Myr);
As all the other simulations, we did not reproduce the positive metallicity gradients observed in some galaxies. Explaining the onset of such features remains a challenge for galaxy formation.
Our results for the low-[Fe/H] dispersions and gradients flattening in time validate the assumptions made in methods to determine the birth radius of stars (Minchev et al. 2018; Lu et al. 2022; Ratcliffe et al. 2023). However, we find that the metallicity gradients of young stars formed at high redshift are almost flat, as a result of enhanced turbulent mixing. This could hinder the assignment of birth radii to the oldest populations (≳11 Gyr), although we note that the galactic disk at these epochs spans only a few kiloparsecs in radius. We also highlight the peculiar behavior in the galactic center, where intense star formation activity, short dynamical mixing timescales, and inward migration contrasts with the rest of the galaxy. This further strengthens the cautionary note from Ratcliffe et al. (2024) that the central metallicity is not representative when deriving galactic-wide profiles and chemo-dynamical evolution scenarios in general.
Our conclusions indicate that the dramatic drop in the dynamical timescales during galactic interactions induces a rapid chemical mixing across the disk(s). These timescales are shorter than that of the enrichment in heavy elements such as iron (e.g., Mennekens et al. 2010), and thus even the accelerated release of these elements by the type Ia supernovae produced during merger-triggered starbursts do not leave a clear distinct imprint on the distributions of metals. This contrasts with the boost in [a/Fe] during starbursts (Renaud et al. 2021b) as the lighter a elements are released much more quickly by type II supernovae on timescales comparable to or even shorter than the dynamical times of the interaction and/or starburst episode. We then argue that, with sufficient accuracy in the observational chemical and age measurements, future large-scale spectroscopic surveys will be able to identify the epoch of rapid star formation, and associate them with merger events, by searching for their signatures in [α/Fe], but that such an exercise will always be in vain with the use of [Fe/H]. However, this drawback provides a positive note: the long-term insensitivity to mergers of the iron abundances allows us to push back the reconstruction of the assembly of the galactic disk even before the last major merger, and thus to probe up to the earliest epochs of disk settling with appropriate chemical information. The fine details in the radial and azimuthal dispersions of [Fe/H] we find are likely to be within reach of the next generation of spectroscopic surveys.
Acknowledgements
We thank the referee for their constructive report. FR thanks Nils Hoyer and Katarina Kraljic for helpful discussions, and acknowledges support provided by the University of Strasbourg Institute for Advanced Study (USIAS), within the French national programme Investment for the Future (Excellence Initiative) IdEx-Unistra. BR and IM acknowledge support by the Deutsche Forschungsgemeinschaft under the grant MI 2009/2-1. OA acknowledges support from the Knut and Alice Wallenberg Foundation, the Swedish Research Council (grant 2019-04659), and the Swedish National Space Agency (SNSA Dnr 2023-00164).
Appendix A Metallicity gradients of mono-age populations
To complement Figure 6, Figure A.1 shows the evolution of the metallicity gradients of mono-ages populations (one population per panel), formed at each of the 6 epochs considered in Section 3.1.2. For all formation epochs (i.e., in each panel), the evolution of the population corresponds to a flattening of the gradients in [Fe/H].
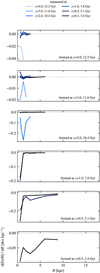 |
Fig. A.1 Evolution of the radial metallicity gradients for the populations of stars formed at the six epochs discussed in Section 3.1.2. Here each panel corresponds to one population, and the evolution of its gradient is shown with darkening colors. |
Appendix B Merger tree
The hierarchical assembly of VINTERGATAN is illustrated by its merger tree in Figure B.1. The main galaxy is the left-most branch. After an intense bombardment by relatively massive companions until ɀ ≈ 1, the late build-up of the galaxy is slower, paced by minor mergers only. This transition is key in the construction of the thick versus thin disk, the kinematics, and the chemical content of these structures, as described in Renaud et al. (2021b).
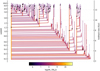 |
Fig. B.1 Merger tree of VINTERGATAN computed using the stellar component. A dot at the top of a branch marks the earliest detection of the stellar component of the corresponding galaxy. The thickness and the color of the branches indicate the stellar mass. Major mergers, i.e., mergers with a stellar mass ratio greater than 1:10, are indicated by a black square. |
References
- Abdurro’uf, Accetta, K., Aerts, C., et al. 2022, ApJS, 259, 35 [NASA ADS] [CrossRef] [Google Scholar]
- Acharyya, A., Peeples, M. S., Tumlinson, J., et al. 2024, arXiv e-prints [arXiv:2404.06613] [Google Scholar]
- Agertz, O., Renaud, F., et al. 2021, MNRAS, 503, 5826 [NASA ADS] [CrossRef] [Google Scholar]
- Anders, E., & Grevesse, N. 1989, Geochim. Cosmochim. Acta, 53, 197 [Google Scholar]
- Anders, F., Chiappini, C., Santiago, B. X., et al. 2014, A&A, 564, A115 [NASA ADS] [CrossRef] [EDP Sciences] [Google Scholar]
- Anders, F., Chiappini, C., Rodrigues, T. S., et al. 2017, A&A, 597, A30 [NASA ADS] [CrossRef] [EDP Sciences] [Google Scholar]
- Belfiore, F., Maiolino, R., Tremonti, C., et al. 2017, MNRAS, 469, 151 [Google Scholar]
- Bellardini, M. A., Wetzel, A., Loebman, S. R., & Bailin, J. 2022, MNRAS, 514, 4270 [NASA ADS] [CrossRef] [Google Scholar]
- Belokurov, V., Erkal, D., Evans, N. W., Koposov, S. E., & Deason, A. J. 2018, MNRAS, 478, 611 [Google Scholar]
- Birnboim, Y., & Dekel, A. 2003, MNRAS, 345, 349 [Google Scholar]
- Blancato, K., Ness, M., Johnston, K. V., Rybizki, J., & Bedell, M. 2019, ApJ, 883, 34 [NASA ADS] [CrossRef] [Google Scholar]
- Bland-Hawthorn, J., Krumholz, M. R., & Freeman, K. 2010, ApJ, 713, 166 [CrossRef] [Google Scholar]
- Boeche, C., Siebert, A., Piffl, T., et al. 2014, A&A, 568, A71 [NASA ADS] [CrossRef] [EDP Sciences] [Google Scholar]
- Bovy, J., Rix, H.-W., Schlafly, E. F., et al. 2016, ApJ, 823, 30 [NASA ADS] [CrossRef] [Google Scholar]
- Bresolin, F. 2007, ApJ, 656, 186 [NASA ADS] [CrossRef] [Google Scholar]
- Buck, T., Rybizki, J., Buder, S., et al. 2021, MNRAS, 508, 3365 [NASA ADS] [CrossRef] [Google Scholar]
- Buck, T., Obreja, A., Ratcliffe, B., et al. 2023, MNRAS, 523, 1565 [CrossRef] [Google Scholar]
- Buder, S., Sharma, S., Kos, J., et al. 2021, MNRAS, 506, 150 [NASA ADS] [CrossRef] [Google Scholar]
- Carr, C., Johnston, K. V., Laporte, C. F. P., & Ness, M. K. 2022, MNRAS, 516, 5067 [NASA ADS] [CrossRef] [Google Scholar]
- Casamiquela, L., Castro-Ginard, A., Anders, F., & Soubiran, C. 2021, A&A, 654, A151 [NASA ADS] [CrossRef] [EDP Sciences] [Google Scholar]
- Chiappini, C., Matteucci, F., & Gratton, R. 1997, ApJ, 477, 765 [Google Scholar]
- Ciucă, I., Kawata, D., Miglio, A., Davies, G. R., & Grand, R. J. J. 2021, MNRAS, 503, 2814 [Google Scholar]
- Curti, M., Mannucci, F., Cresci, G., & Maiolino, R. 2020, MNRAS, 491, 944 [Google Scholar]
- Di Matteo, P., Haywood, M., Combes, F., Semelin, B., & Snaith, O. N. 2013, A&A, 553, A102 [NASA ADS] [CrossRef] [EDP Sciences] [Google Scholar]
- Donor, J., Frinchaboy, P. M., Cunha, K., et al. 2020, AJ, 159, 199 [NASA ADS] [CrossRef] [Google Scholar]
- Fragkoudi, F., Grand, R. J. J., Pakmor, R., et al. 2020, MNRAS, 494, 5936 [Google Scholar]
- Frankel, N., Rix, H.-W., Ting, Y.-S., Ness, M., & Hogg, D. W. 2018, ApJ, 865, 96 [NASA ADS] [CrossRef] [Google Scholar]
- Freeman, K., & Bland-Hawthorn, J. 2002, ARA&A, 40, 487 [Google Scholar]
- Garcia-Dias, R., Allende Prieto, C., Sánchez Almeida, J., & Alonso Palicio, P. 2019, A&A, 629, A34 [NASA ADS] [CrossRef] [EDP Sciences] [Google Scholar]
- Gibson, B. K., Pilkington, K., Brook, C. B., Stinson, G. S., & Bailin, J. 2013, A&A, 554, A47 [CrossRef] [EDP Sciences] [Google Scholar]
- Graf, R. L., Wetzel, A., Bellardini, M. A., & Bailin, J. 2024, arXiv e-prints [arXiv:2402.15614] [Google Scholar]
- Grand, R. J. J., Springel, V., Kawata, D., et al. 2016, MNRAS, 460, L94 [Google Scholar]
- Hackshaw, Z., Hawkins, K., Filion, C., et al. 2024, arXiv e-prints [arXiv:2405.18120] [Google Scholar]
- Hawkins, K. 2023, MNRAS, 525, 3318 [NASA ADS] [CrossRef] [Google Scholar]
- Haywood, M., Di Matteo, P., Lehnert, M. D., Katz, D., & Gómez, A. 2013, A&A, 560, A109 [NASA ADS] [CrossRef] [EDP Sciences] [Google Scholar]
- Haywood, M., Di Matteo, P., Lehnert, M. D., et al. 2018, ApJ, 863, 113 [Google Scholar]
- Haywood, M., Khoperskov, S., Cerqui, V., et al. 2024, A&A, 690, A147 [NASA ADS] [CrossRef] [EDP Sciences] [Google Scholar]
- Helmi, A., Babusiaux, C., Koppelman, H. H., et al. 2018, Nature, 563, 85 [Google Scholar]
- Hogg, D. W., Casey, A. R., Ness, M., et al. 2016, ApJ, 833, 262 [NASA ADS] [CrossRef] [Google Scholar]
- Hopkins, P. F., Kereš, D., Oñorbe, J., et al. 2014, MNRAS, 445, 581 [NASA ADS] [CrossRef] [Google Scholar]
- Keel, W. C., Kennicutt, Jr., R. C., Hummel, E., & van der Hulst, J. M. 1985, AJ, 90, 708 [NASA ADS] [CrossRef] [Google Scholar]
- Kewley, L. J., Rupke, D., Zahid, H. J., Geller, M. J., & Barton, E. J. 2010, ApJ, 721, L48 [NASA ADS] [CrossRef] [Google Scholar]
- Khoperskov, S., Di Matteo, P., Haywood, M., Gómez, A., & Snaith, O. N. 2020, A&A, 638, A144 [NASA ADS] [CrossRef] [EDP Sciences] [Google Scholar]
- Kreckel, K., Ho, I. T., Blanc, G. A., et al. 2020, MNRAS, 499, 193 [NASA ADS] [CrossRef] [Google Scholar]
- Kubryk, M., Prantzos, N., & Athanassoula, E. 2013, MNRAS, 436, 1479 [NASA ADS] [CrossRef] [Google Scholar]
- Le Conte, Z. A., Gadotti, D. A., Ferreira, L., et al. 2024, MNRAS, 530, 1984 [NASA ADS] [CrossRef] [Google Scholar]
- Lu, Y., Minchev, I., Buck, T., et al. 2022, arXiv e-prints [arXiv:2212.04515] [Google Scholar]
- Marino, R. A., Gil de Paz, A., Sánchez, S. F., et al. 2016, A&A, 585, A47 [NASA ADS] [CrossRef] [EDP Sciences] [Google Scholar]
- Matteucci, F., & Recchi, S. 2001, ApJ, 558, 351 [NASA ADS] [CrossRef] [Google Scholar]
- Melvin, T., Masters, K., Lintott, C., et al. 2014, MNRAS, 438, 2882 [Google Scholar]
- Mennekens, N., Vanbeveren, D., De Greve, J. P., & De Donder, E. 2010, A&A, 515, A89 [NASA ADS] [CrossRef] [EDP Sciences] [Google Scholar]
- Minchev, I., & Famaey, B. 2010, ApJ, 722, 112 [Google Scholar]
- Minchev, I., Chiappini, C., & Martig, M. 2013, A&A, 558, A9 [CrossRef] [EDP Sciences] [Google Scholar]
- Minchev, I., Chiappini, C., Martig, M., et al. 2014, ApJ, 781, L20 [Google Scholar]
- Minchev, I., Anders, F., Recio-Blanco, A., et al. 2018, MNRAS, 481, 1645 [NASA ADS] [CrossRef] [Google Scholar]
- Molina, J., Ibar, E., Swinbank, A. M., et al. 2017, MNRAS, 466, 892 [NASA ADS] [CrossRef] [Google Scholar]
- Monari, G., Famaey, B., Siebert, A., et al. 2016, MNRAS, 461, 3835 [Google Scholar]
- Moreno, J., Torrey, P., Ellison, S. L., et al. 2019, MNRAS, 485, 1320 [NASA ADS] [CrossRef] [Google Scholar]
- Moustakas, J., Kennicutt, Robert C., J., Tremonti, C. A., et al. 2010, ApJS, 190, 233 [NASA ADS] [CrossRef] [Google Scholar]
- Muñoz-Elgueta, N., Torres-Flores, S., Amram, P., et al. 2018, MNRAS, 480, 3257 [CrossRef] [Google Scholar]
- Müller, J. 2000, J. Res. Natl. Inst. Standards Technol., 105, 551 [CrossRef] [Google Scholar]
- Ness, M. K., Wheeler, A. J., McKinnon, K., et al. 2022, ApJ, 926, 144 [NASA ADS] [CrossRef] [Google Scholar]
- Nissen, P. E., & Schuster, W. J. 2010, A&A, 511, L10 [NASA ADS] [CrossRef] [EDP Sciences] [Google Scholar]
- Olivares, V., Salomé, P., Hamer, S. L., et al. 2022, A&A, 666, A94 [NASA ADS] [CrossRef] [EDP Sciences] [Google Scholar]
- Orr, M. E., Burkhart, B., Wetzel, A., et al. 2023, MNRAS, 521, 3708 [NASA ADS] [CrossRef] [Google Scholar]
- Padoan, P., Haugbølle, T., & Nordlund, Å. 2012, ApJ, 759, L27 [Google Scholar]
- Petersson, J., Renaud, F., Agertz, O., Dekel, A., & Duc, P.-A. 2023, MNRAS, 518, 3261 [Google Scholar]
- Pilkington, K., Few, C. G., Gibson, B. K., et al. 2012, A&A, 540, A56 [NASA ADS] [CrossRef] [EDP Sciences] [Google Scholar]
- Poetrodjojo, H., Groves, B., Kewley, L. J., et al. 2018, MNRAS, 479, 5235 [Google Scholar]
- Price-Jones, N., Bovy, J., Webb, J. J., et al. 2020, MNRAS, 496, 5101 [NASA ADS] [CrossRef] [Google Scholar]
- Ratcliffe, B. L., Ness, M. K., Buck, T., et al. 2022, ApJ, 924, 60 [NASA ADS] [CrossRef] [Google Scholar]
- Ratcliffe, B., Minchev, I., Anders, F., et al. 2023, MNRAS, 525, 2208 [NASA ADS] [CrossRef] [Google Scholar]
- Ratcliffe, B., Khoperskov, S., Minchev, I., et al. 2024, A&A, 690, A352 [NASA ADS] [CrossRef] [EDP Sciences] [Google Scholar]
- Renaud, F., Bournaud, F., Kraljic, K., & Duc, P.-A. 2014, MNRAS, 442, L33 [NASA ADS] [CrossRef] [Google Scholar]
- Renaud, F., Bournaud, F., Daddi, E., & Weiß, A. 2019, A&A, 621, A104 [NASA ADS] [CrossRef] [EDP Sciences] [Google Scholar]
- Renaud, F., Agertz, O., Andersson, E. P., et al. 2021a, MNRAS, 503, 5868 [NASA ADS] [CrossRef] [Google Scholar]
- Renaud, F., Agertz, O., Read, J. I., et al. 2021b, MNRAS, 503, 5846 [NASA ADS] [CrossRef] [Google Scholar]
- Renaud, F., Romeo, A. B., & Agertz, O. 2021c, MNRAS, 508, 352 [NASA ADS] [CrossRef] [Google Scholar]
- Reddish, J., Kraljic, K., Petersen, M. S., et al. 2022, MNRAS, 512, 160 [NASA ADS] [CrossRef] [Google Scholar]
- Rich, J. A., Torrey, P., Kewley, L. J., Dopita, M. A., & Rupke, D. S. N. 2012, ApJ, 753, 5 [NASA ADS] [CrossRef] [Google Scholar]
- Romeo, A. B., Agertz, O., & Renaud, F. 2023, MNRAS, 518, 1002 [Google Scholar]
- Roškar, R., Debattista, V. P., Quinn, T. R., Stinson, G. S., & Wadsley, J. 2008, ApJ, 684, L79 [Google Scholar]
- Ruchti, G. R., Read, J. I., Feltzing, S., et al. 2015, MNRAS, 450, 2874 [NASA ADS] [CrossRef] [Google Scholar]
- Sánchez, S. F., Rosales-Ortega, F. F., Iglesias-Páramo, J., et al. 2014, A&A, 563, A49 [CrossRef] [EDP Sciences] [Google Scholar]
- Segovia Otero, Á., Renaud, F., & Agertz, O. 2022, MNRAS, 516, 2272 [NASA ADS] [CrossRef] [Google Scholar]
- Sellwood, J. A., & Binney, J. J. 2002, MNRAS, 336, 785 [Google Scholar]
- Semenov, V. A., Kravtsov, A. V., & Gnedin, N. Y. 2017, ApJ, 845, 133 [NASA ADS] [CrossRef] [Google Scholar]
- Simons, R. C., Papovich, C., Momcheva, I., et al. 2021, ApJ, 923, 203 [NASA ADS] [CrossRef] [Google Scholar]
- Smiljanic, R., Donati, P., Bragaglia, A., Lemasle, B., & Romano, D. 2018, A&A, 616, A112 [NASA ADS] [CrossRef] [EDP Sciences] [Google Scholar]
- Spitoni, E., Silva Aguirre, V., Matteucci, F., Calura, F., & Grisoni, V. 2019, A&A, 623, A60 [NASA ADS] [CrossRef] [EDP Sciences] [Google Scholar]
- Teyssier, R. 2002, A&A, 385, 337 [CrossRef] [EDP Sciences] [Google Scholar]
- Ting, Y.-S., Conroy, C., & Goodman, A. 2015, ApJ, 807, 104 [NASA ADS] [CrossRef] [Google Scholar]
- Tinsley, B. M. 1979, ApJ, 229, 1046 [Google Scholar]
- Venturi, G., Carniani, S., Parlanti, E., et al. 2024, A&A, 691, A19 [NASA ADS] [CrossRef] [EDP Sciences] [Google Scholar]
- Verwilghen, P., Emsellem, E., Renaud, F., et al. 2024, A&A, 687, A53 [NASA ADS] [CrossRef] [EDP Sciences] [Google Scholar]
- Vincenzo, F., & Kobayashi, C. 2020, MNRAS, 496, 80 [NASA ADS] [CrossRef] [Google Scholar]
- Wang, T.-M., Magnelli, B., Schinnerer, E., et al. 2022, A&A, 660, A142 [NASA ADS] [CrossRef] [EDP Sciences] [Google Scholar]
- Wenger, T. V., Balser, D. S., Anderson, L. D., & Bania, T. M. 2019, ApJ, 887, 114 [NASA ADS] [CrossRef] [Google Scholar]
- Wetzel, A. R., Hopkins, P. F., Kim, J.-h., et al. 2016, ApJ, 827, L23 [NASA ADS] [CrossRef] [Google Scholar]
- Woosley, S. E., & Heger, A. 2007, Phys. Rep., 442, 269 [Google Scholar]
- Wuyts, E., Wisnioski, E., Fossati, M., et al. 2016, ApJ, 827, 74 [NASA ADS] [CrossRef] [Google Scholar]
In good agreement with the observed value of −0.058 dex kpc−1 in the thin disk (Anders et al. 2017).
The exact origin of this gas is difficult to determine, but we suspect its accretion is triggered by the tidal stripping of the incoming satellite galaxy as other similar patterns of decreasing maximum metallicity are also seen at the epochs of the first pericenter passages of all major mergers VINTERGATAN experiences (see Renaud etal. 2021b, their Figures 2 and 4).
Although the depletion time, as the ratio of the gas mass to the SFR, reflects the timescale of star formation, it cannot be directly compared to dynamical times as the true depletion of the gas reservoir is regulated by feedback. Here, we use this estimate to argue that chemical mixing could still be inefficient near the galactic center, despite the short dynamical timescales, if the star formation timescale is short.
The starburst-induced chemical enrichment is much more rapid when considering lighter elements, which are released more promptly, e.g., by type II supernovae. For instance, wet mergers have been shown to leave a clear signature of boosted [ɑ/Fe] during the starburst episode they trigger (Renaud et al. 2021b).
This velocity varies along the interaction between the pericenter and apocenter. We estimate its mean value to be 210 km s−1 , giving a corotation radius of ≈2.5 kpc during the separation phase.
All Figures
|
Fig. 1 Maps of the median metallicity of all the stars in the radial and azimuthal bins described in Section 2, at the six epochs analyzed in this paper. To ease the comparison between epochs, the color scale is identical for all panels. The radial range covered is 18 kpc, with grid lines in gray every 2.5 kpc. |
| In the text | |
|
Fig. 2 Radial profiles of the metallicity of all the stars, measured at different epochs (indicated by their redshifts and look-back times; see legend) as the median in logarithmically spaced radial bins. The shaded areas show the robust standard deviation σannulus in each radial bin (Equation (2)). |
| In the text | |
|
Fig. 3 Top: robust standard deviation of the metallicity in logarithmically spaced radial bins. Bottom: Anisotropy parameter (Equation (4)) quantifying the importance of azimuthal variations in the scatter of metallicity at a given radius. A valuer χ ≈ 0 indicates an isotropic scatter. The colors are as in Figure 2. The differences in the radial extents of the two quantities are caused by low number statistics in the outer galaxy, which forbids the azimuthal binning necessary to compute χ. |
| In the text | |
|
Fig. 4 Radial profiles of the metallicity of the young stars only. The profiles for all the stars are reproduced from Figure 2 with thin lines, for reference. |
| In the text | |
|
Fig. 5 Same as Figure 3, but only for the young stars. The ranges of the vertical axes are not the same as in Figure 3. The colors are as in Figures 2, 3, and 4. |
| In the text | |
|
Fig. 6 Radial distributions of [Fe/H] of stars formed at different epochs. Each panel corresponds to one epoch, as indicated in the lower right corner. The filled contours show the distributions of young stars (<100 Myr) formed at this epoch, with levels corresponding to 0.01 and 1% of the stellar population. These stars are then tracked to the following epochs, and their evolved distributions are shown in the subsequent panels with line contours, but always keeping the same color across all panels. |
| In the text | |
|
Fig. 7 Median radial migration rate of stars. As in Figure 6, each color corresponds to a population of stars, followed at different epochs (different panels). The quantity plotted is the median of the difference between the radius at the given epoch (the quantity on the x-axis) and the birth radius, divided by the time difference between the two epochs, with the convention of a positive value for an outward migration. By considering the instantaneous radius (instead of the average), the migration measured here includes both the blurring and churning effects. |
| In the text | |
|
Fig. 8 Distributions in [Fe/H] of all the stars in the galaxies involved in the six major merger events in VINTERGATAN. The distributions are normalized by the total stellar mass of the galaxies. Each color represents a merger event; the mass ratio, redshift, and look-back time are indicated in the top right corner. At ɀ = 2.7 two distinct events cannot be separated by the time resolution of the simulation outputs, and are thus labeled with the same redshift. The [Fe/H] distributions of VINTERGATAN (i.e., the most massive Milky Way-like progenitor) at the epochs of the mergers are shown with the filled histogram, for comparison with that of its companion galaxies (solid lines). |
| In the text | |
|
Fig. 9 Top: in situ SFR around the epoch of the last major merger. The colored solid vertical lines indicate the snapshots studied in Section 3.2. These snapshots are sorted into three groups: pre-merger (orange); interaction, separation, and merger (blue); and post-merger (green). The thick lines indicate the first and second (last) pericenter passages. The dotted lines mark the two pericenter passages of the previous major merger. Bottom: radial distribution of the SFR, normalized to the total SFR at these epochs, and smoothed for the sake of readability. |
| In the text | |
|
Fig. 10 Variations in the radial profiles of metallicity for all the stars at the instants marked in Figure 9, i.e., approximately every 150 Myr around the epoch of the last major merger. A pre-merger reference profile is computed by stacking the data from the first three snapshots shown here, and then subtracted from all the profiles to show the relative variations. |
| In the text | |
|
Fig. 11 Same as Figure 10, but only for the newly formed stars, i.e., formed less than 100 Myr before each snapshot. |
| In the text | |
|
Fig. 12 Radial profiles of the annulus dispersion and anisotropy parameter for all the stars around the epoch of the last major merger. These quantities correspond to the median profiles in Figure 10. |
| In the text | |
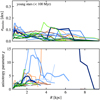 |
Fig. 13 Same as Figure 12, but only for the young stars. |
| In the text | |
|
Fig. A.1 Evolution of the radial metallicity gradients for the populations of stars formed at the six epochs discussed in Section 3.1.2. Here each panel corresponds to one population, and the evolution of its gradient is shown with darkening colors. |
| In the text | |
|
Fig. B.1 Merger tree of VINTERGATAN computed using the stellar component. A dot at the top of a branch marks the earliest detection of the stellar component of the corresponding galaxy. The thickness and the color of the branches indicate the stellar mass. Major mergers, i.e., mergers with a stellar mass ratio greater than 1:10, are indicated by a black square. |
| In the text | |
Current usage metrics show cumulative count of Article Views (full-text article views including HTML views, PDF and ePub downloads, according to the available data) and Abstracts Views on Vision4Press platform.
Data correspond to usage on the plateform after 2015. The current usage metrics is available 48-96 hours after online publication and is updated daily on week days.
Initial download of the metrics may take a while.