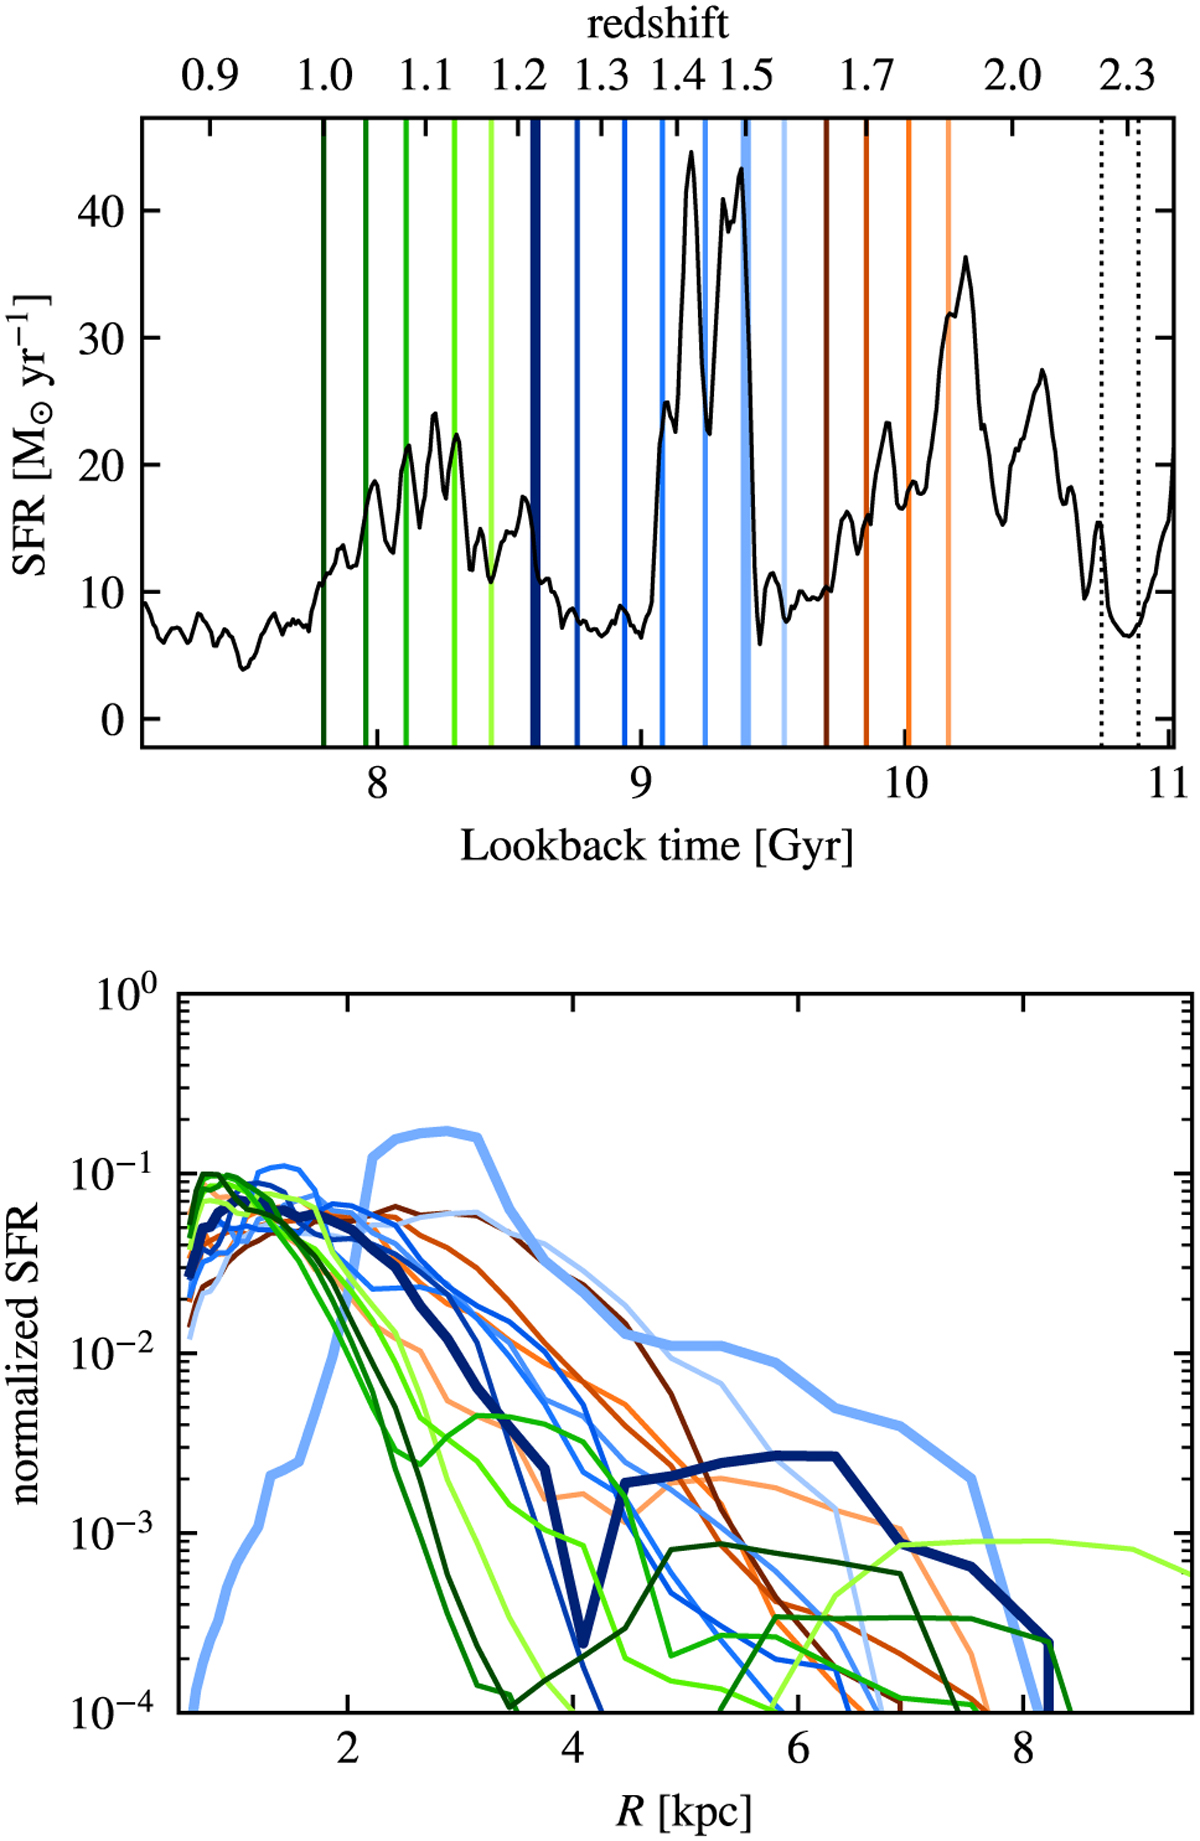
Fig. 9
Download original image
Top: in situ SFR around the epoch of the last major merger. The colored solid vertical lines indicate the snapshots studied in Section 3.2. These snapshots are sorted into three groups: pre-merger (orange); interaction, separation, and merger (blue); and post-merger (green). The thick lines indicate the first and second (last) pericenter passages. The dotted lines mark the two pericenter passages of the previous major merger. Bottom: radial distribution of the SFR, normalized to the total SFR at these epochs, and smoothed for the sake of readability.
Current usage metrics show cumulative count of Article Views (full-text article views including HTML views, PDF and ePub downloads, according to the available data) and Abstracts Views on Vision4Press platform.
Data correspond to usage on the plateform after 2015. The current usage metrics is available 48-96 hours after online publication and is updated daily on week days.
Initial download of the metrics may take a while.