Fig. 14.
Download original image
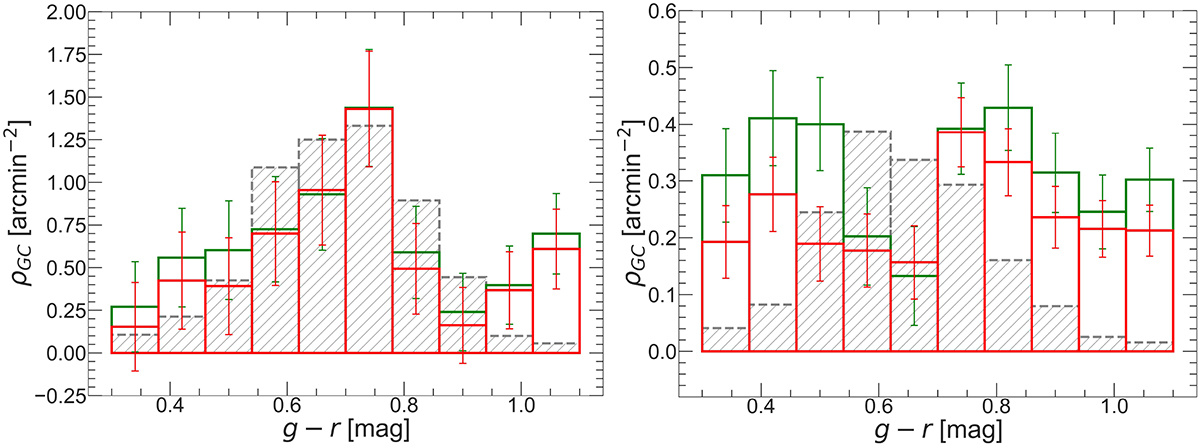
Colour (g − r) distribution of GC candidates within Re, GC of NGC 5018 (left) and in the elliptical over-density region (right) after annular and random background subtraction (shown in red and green histograms, respectively). The grey dashed histogram (with arbitrary normalisation, to get a similar scale) represents the spectroscopically confirmed GCs in NGC 1399 (left) and in the entire Fornax cluster (right) from the FDS data (Cantiello et al. 2020).
Current usage metrics show cumulative count of Article Views (full-text article views including HTML views, PDF and ePub downloads, according to the available data) and Abstracts Views on Vision4Press platform.
Data correspond to usage on the plateform after 2015. The current usage metrics is available 48-96 hours after online publication and is updated daily on week days.
Initial download of the metrics may take a while.