Fig. 12.
Download original image
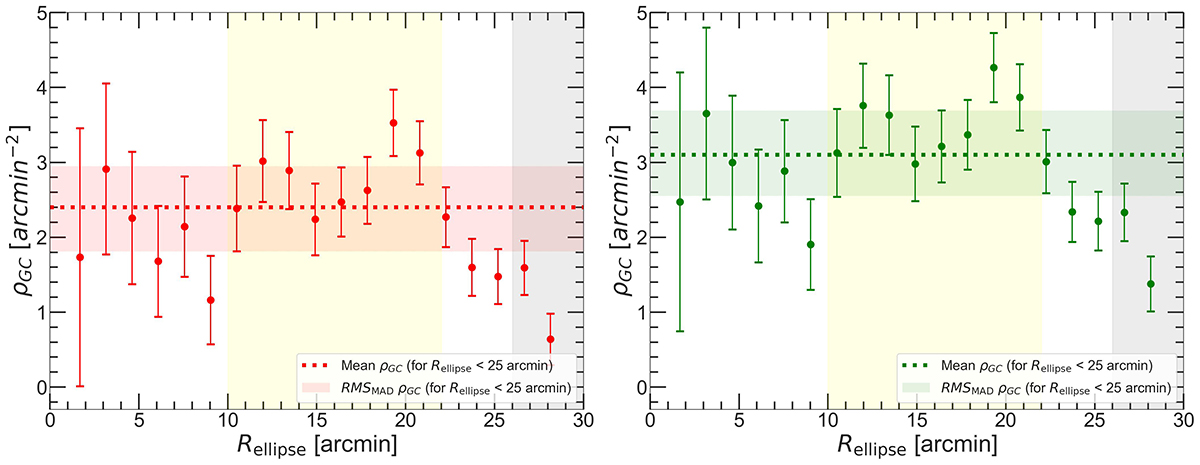
Density profile of GC candidates in the elliptical over-density region obtained by subtracting annular background (left panel) and random background (right panel). The grey shaded region in both the panels beyond 26′ represents the annular background region. The red and green dotted horizontal lines and shaded regions in the left and right panels, respectively, represent the mean and RMSMAD density values within elliptical radius Rellipse < 25′. The yellow shaded regions in both the panels represent the region encompassing NGC 5018 and other GC over-densities surrounding the group (see Sect. 6.1).
Current usage metrics show cumulative count of Article Views (full-text article views including HTML views, PDF and ePub downloads, according to the available data) and Abstracts Views on Vision4Press platform.
Data correspond to usage on the plateform after 2015. The current usage metrics is available 48-96 hours after online publication and is updated daily on week days.
Initial download of the metrics may take a while.