Fig. 6.
Download original image
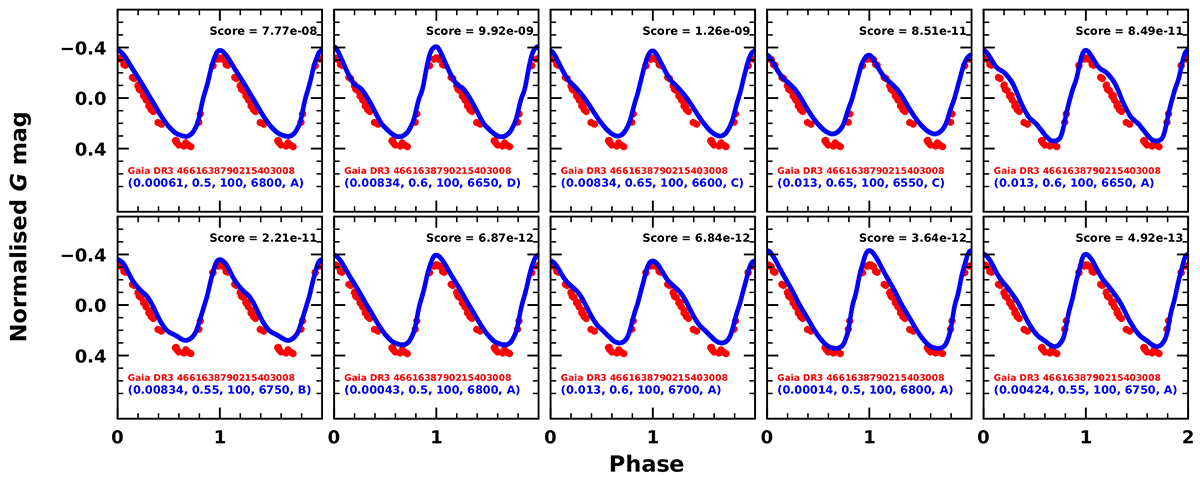
Example of the ten best-matched models corresponding to one particular observed BL Her star, Gaia DR3 4661638790215403008. The observed light curve is shown in red and the theoretical light curves in blue. The input stellar parameters of the corresponding models are included in the format (Z, M/M⊙, L/L⊙, Teff, convection set) in each subplot.
Current usage metrics show cumulative count of Article Views (full-text article views including HTML views, PDF and ePub downloads, according to the available data) and Abstracts Views on Vision4Press platform.
Data correspond to usage on the plateform after 2015. The current usage metrics is available 48-96 hours after online publication and is updated daily on week days.
Initial download of the metrics may take a while.