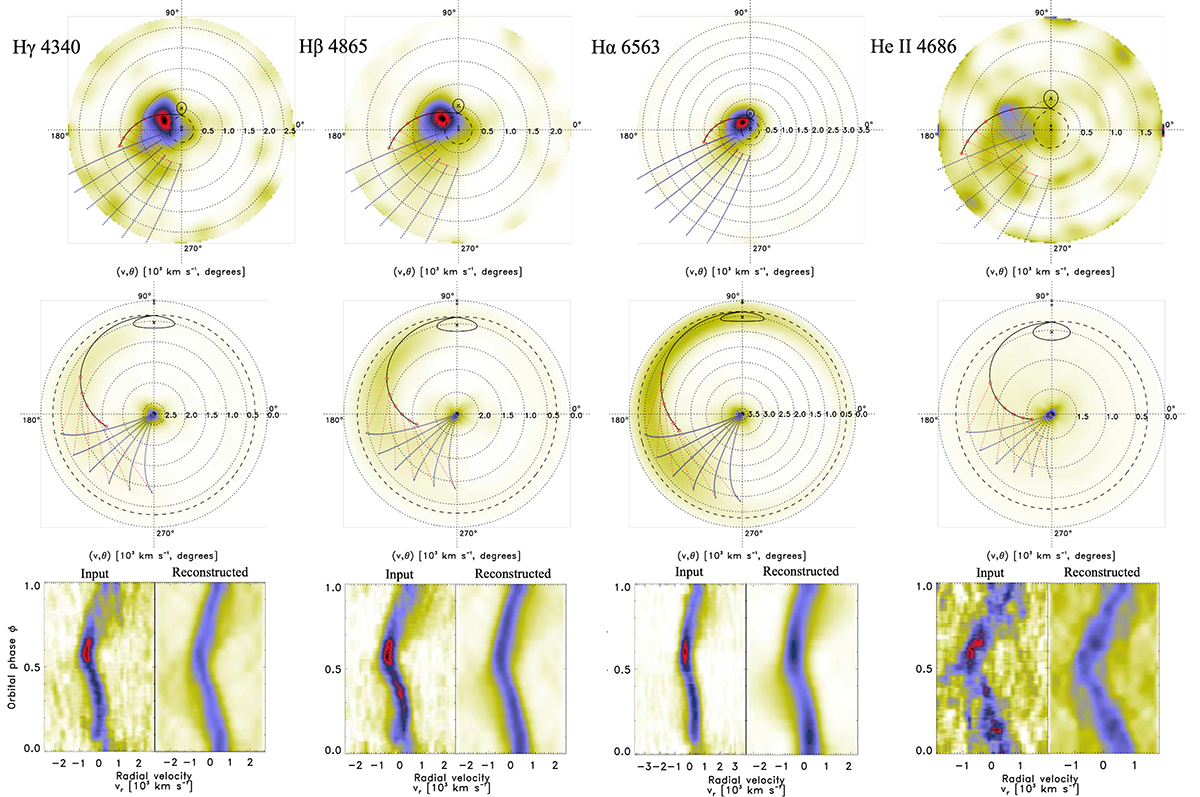
Fig. 5.
Download original image
Doppler tomograms of Balmer emissions (Hα, Hβ, and Hγ) and He II emission, along with their trailed spectra. The upper panel shows the standard Doppler tomograms, the middle panel presents the inside-out projections, and the bottom panel shows the trailed input and reconstructed spectra. The velocities of the Roche lobes of the WD (shown as the black dashed closed line) and the donor star (shown as the black continuous closed line) components are overlayed on the tomograms. The velocities of the ballistic trajectory (shown as the black continuous line) and the magnetic part of the trajectory (shown as blue dashed lines) are superimposed.
Current usage metrics show cumulative count of Article Views (full-text article views including HTML views, PDF and ePub downloads, according to the available data) and Abstracts Views on Vision4Press platform.
Data correspond to usage on the plateform after 2015. The current usage metrics is available 48-96 hours after online publication and is updated daily on week days.
Initial download of the metrics may take a while.