Fig. 3.
Download original image
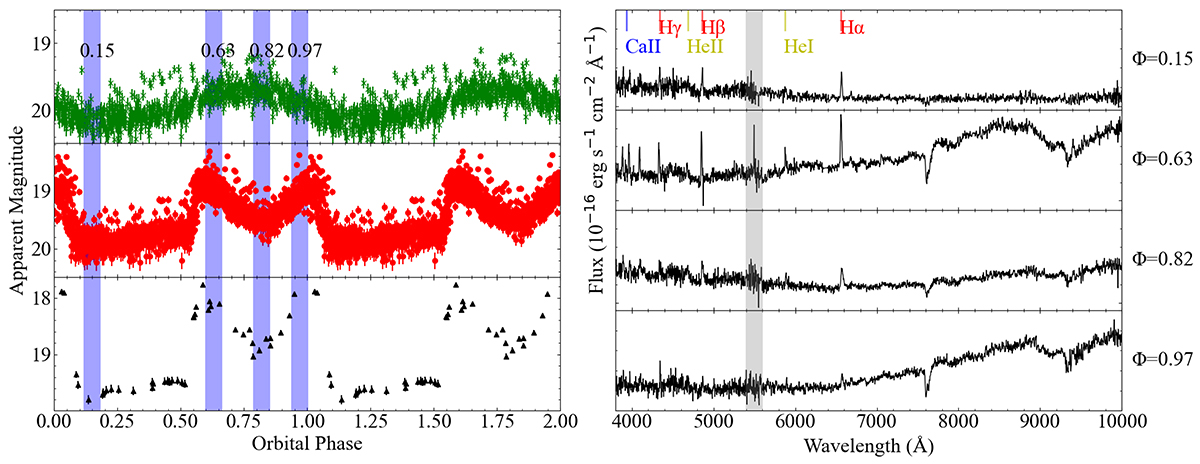
ZTF photometry taken over two orbits (left) and multi-phase spectroscopy (right) of ZTF J0112+5827 are presented. The blue highlighting in the left panels marks the phases of the spectra. The right panels display example spectra corresponding to phases of 0.15, 0.63, 0.82, and 0.97. The gray areas indicate the regions where red and blue spectra are stitched together, accompanied by a relatively low signal-to-noise ratio.
Current usage metrics show cumulative count of Article Views (full-text article views including HTML views, PDF and ePub downloads, according to the available data) and Abstracts Views on Vision4Press platform.
Data correspond to usage on the plateform after 2015. The current usage metrics is available 48-96 hours after online publication and is updated daily on week days.
Initial download of the metrics may take a while.