Fig. 10.
Download original image
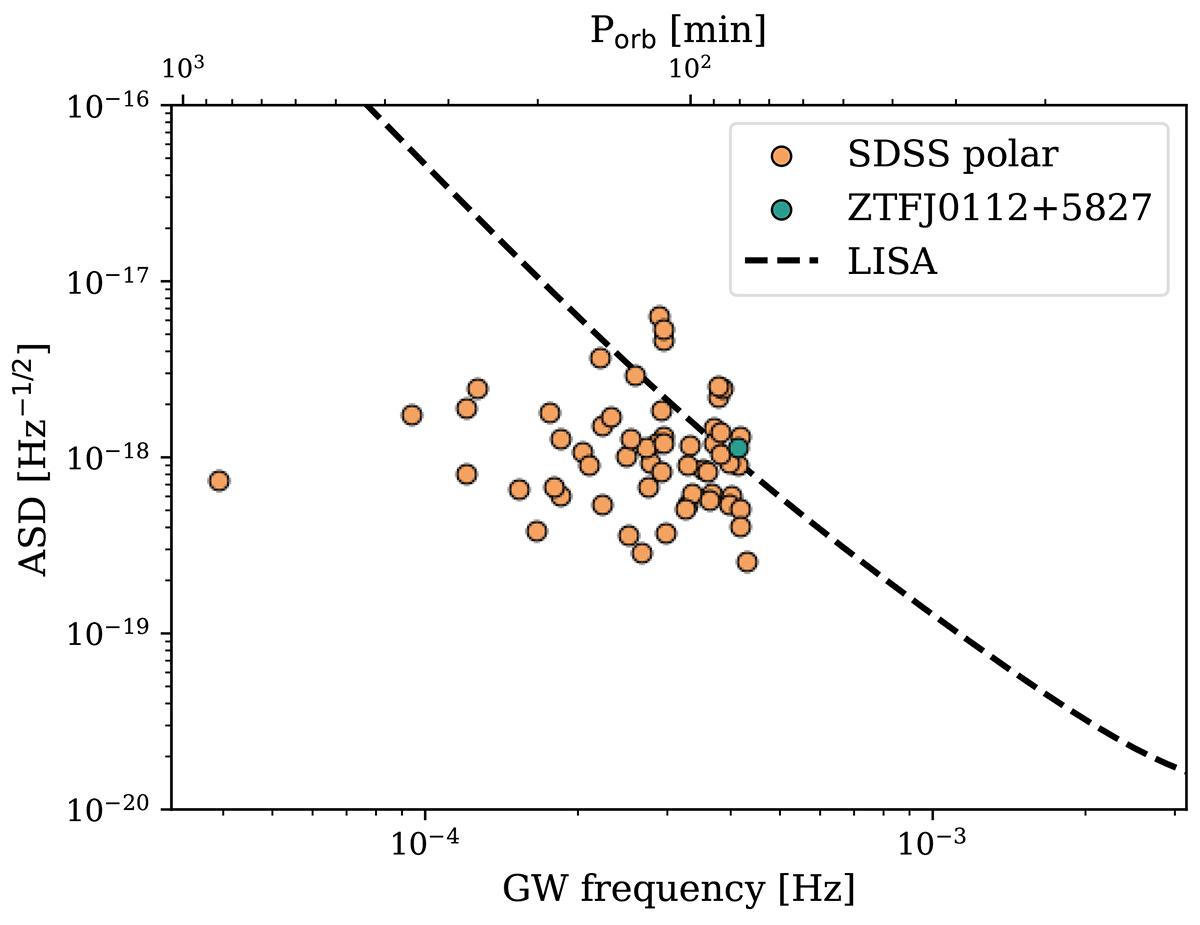
Amplitude spectral density (ASD) calculated over four years of LISA operation, as a function of GW frequency, is shown. Tobs is the observation duration and ![]() is the ASD. The corresponding LISA instrument noise (excluding the galactic foreground) is depicted by the dashed black line. The SDSS polar sample from Inight et al. (2023) is represented by orange circles, with ZTF J0112+5827 highlighted by a blue circle.
is the ASD. The corresponding LISA instrument noise (excluding the galactic foreground) is depicted by the dashed black line. The SDSS polar sample from Inight et al. (2023) is represented by orange circles, with ZTF J0112+5827 highlighted by a blue circle.
Current usage metrics show cumulative count of Article Views (full-text article views including HTML views, PDF and ePub downloads, according to the available data) and Abstracts Views on Vision4Press platform.
Data correspond to usage on the plateform after 2015. The current usage metrics is available 48-96 hours after online publication and is updated daily on week days.
Initial download of the metrics may take a while.