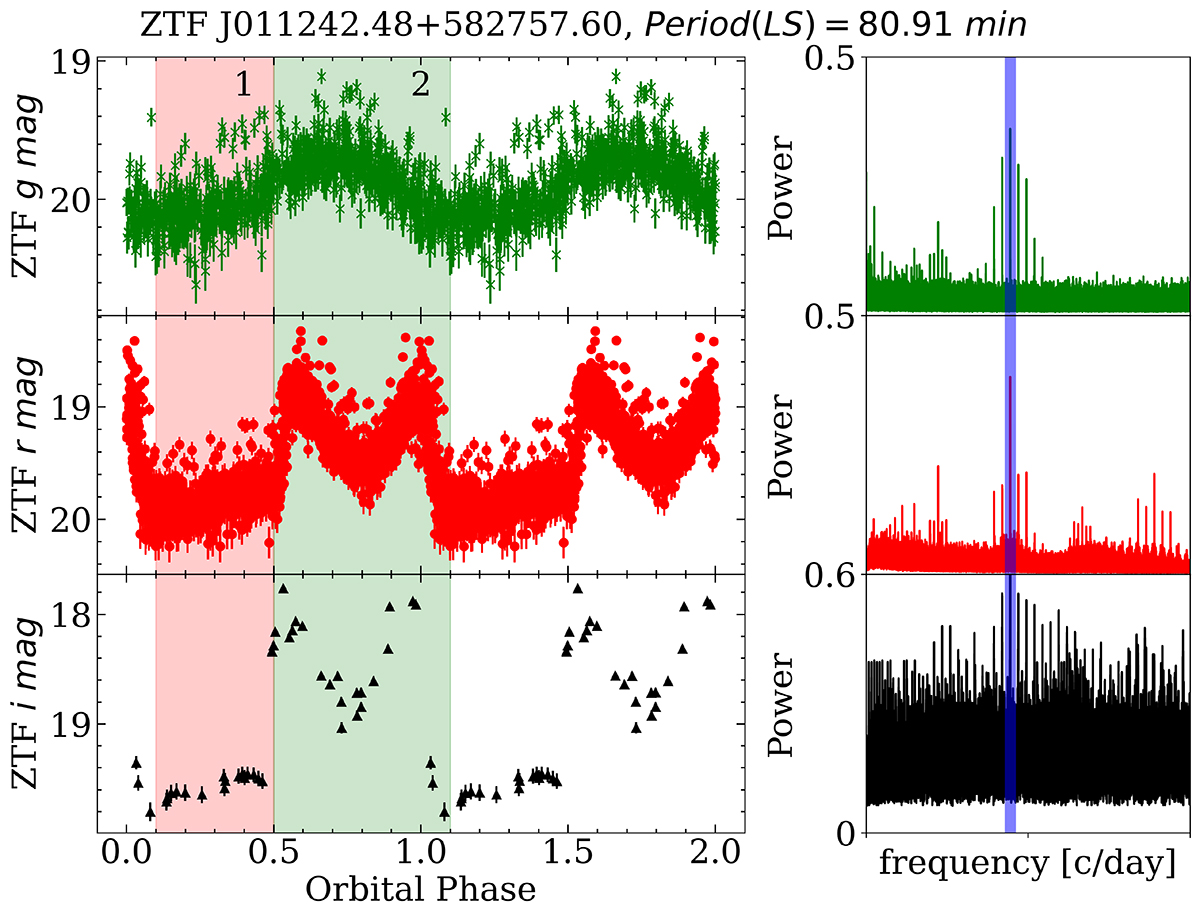
Fig. 1.
Download original image
Light curves of ZTF J0112+5827. Left panels: Phase-folded light curves in ZTF g-band (green), r-band (red) and i-band (black) light curves, using the best-fit period of 80.912 minutes. Right panels: Corresponding power spectra from LS periodogram analysis; the aliases around the dominant frequency are separated by a frequency of once per day, reflecting the nightly sampling.
Current usage metrics show cumulative count of Article Views (full-text article views including HTML views, PDF and ePub downloads, according to the available data) and Abstracts Views on Vision4Press platform.
Data correspond to usage on the plateform after 2015. The current usage metrics is available 48-96 hours after online publication and is updated daily on week days.
Initial download of the metrics may take a while.