Fig. D.1
Download original image
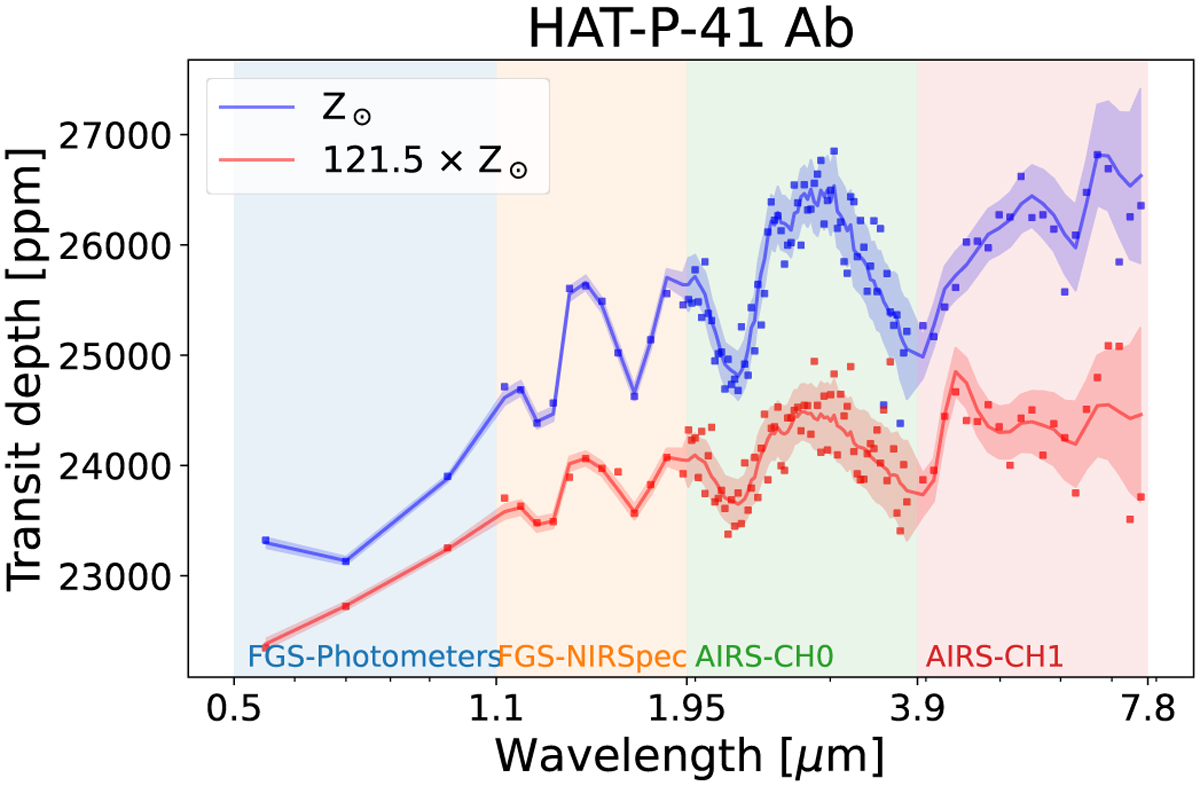
Simulated Ariel transmission spectrum of HAT-P-41 Ab’s atmosphere. The solid lines represent the unscattered spectra. The shaded colored areas correspond to the 1-σ confidence levels of the Ariel observations simulated in Tier 3 of the mission (Edwards et al. 2019). The dots are noisy data representing observed spectra. In red, we show a spectrum with enhanced metallicity, consistent with Sheppard et al. (2021). In blue, we show a spectrum with solar metallicity as derived by Changeat et al. (2022). Ariel will be able to distinguish between these two models with high confidence with three observed transits due to its broad wavelength coverage and high stability.
Current usage metrics show cumulative count of Article Views (full-text article views including HTML views, PDF and ePub downloads, according to the available data) and Abstracts Views on Vision4Press platform.
Data correspond to usage on the plateform after 2015. The current usage metrics is available 48-96 hours after online publication and is updated daily on week days.
Initial download of the metrics may take a while.