Fig. 6
Download original image
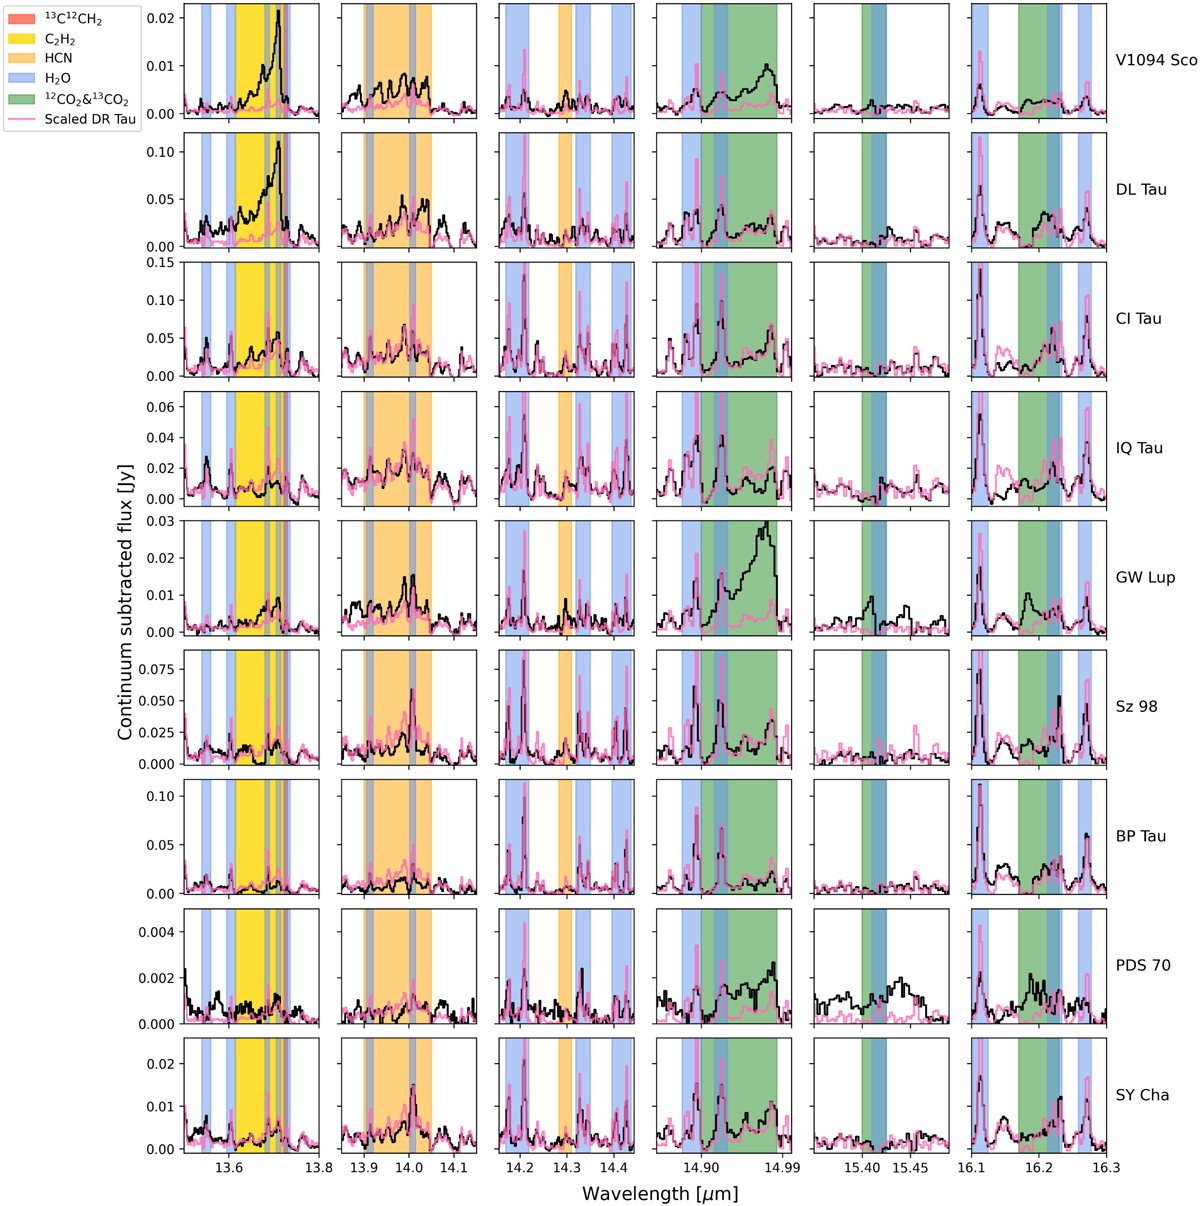
Continuum-subtracted spectra, zoomed in on C2H2 and 13C12CH2 (left-most column), the HCN Q-branch and hot branch (second column and third column), the CO2 Q-branch, 13CO2, and CO2 hot branch (fourth, fifth, and sixth column). The respective features are highlighted in yellow, orange, or green, and prominent H2O features are highlighted in blue. The spectra are once more ordered from largest to smallest ![]() from bottom to top. Note that in the fifth column, the highlighted H2O feature has been subtracted to uncover a potential 13CO2 feature. The rescaled spectrum of DR Tau is included in pink for comparison.
from bottom to top. Note that in the fifth column, the highlighted H2O feature has been subtracted to uncover a potential 13CO2 feature. The rescaled spectrum of DR Tau is included in pink for comparison.
Current usage metrics show cumulative count of Article Views (full-text article views including HTML views, PDF and ePub downloads, according to the available data) and Abstracts Views on Vision4Press platform.
Data correspond to usage on the plateform after 2015. The current usage metrics is available 48-96 hours after online publication and is updated daily on week days.
Initial download of the metrics may take a while.