Fig. 5
Download original image
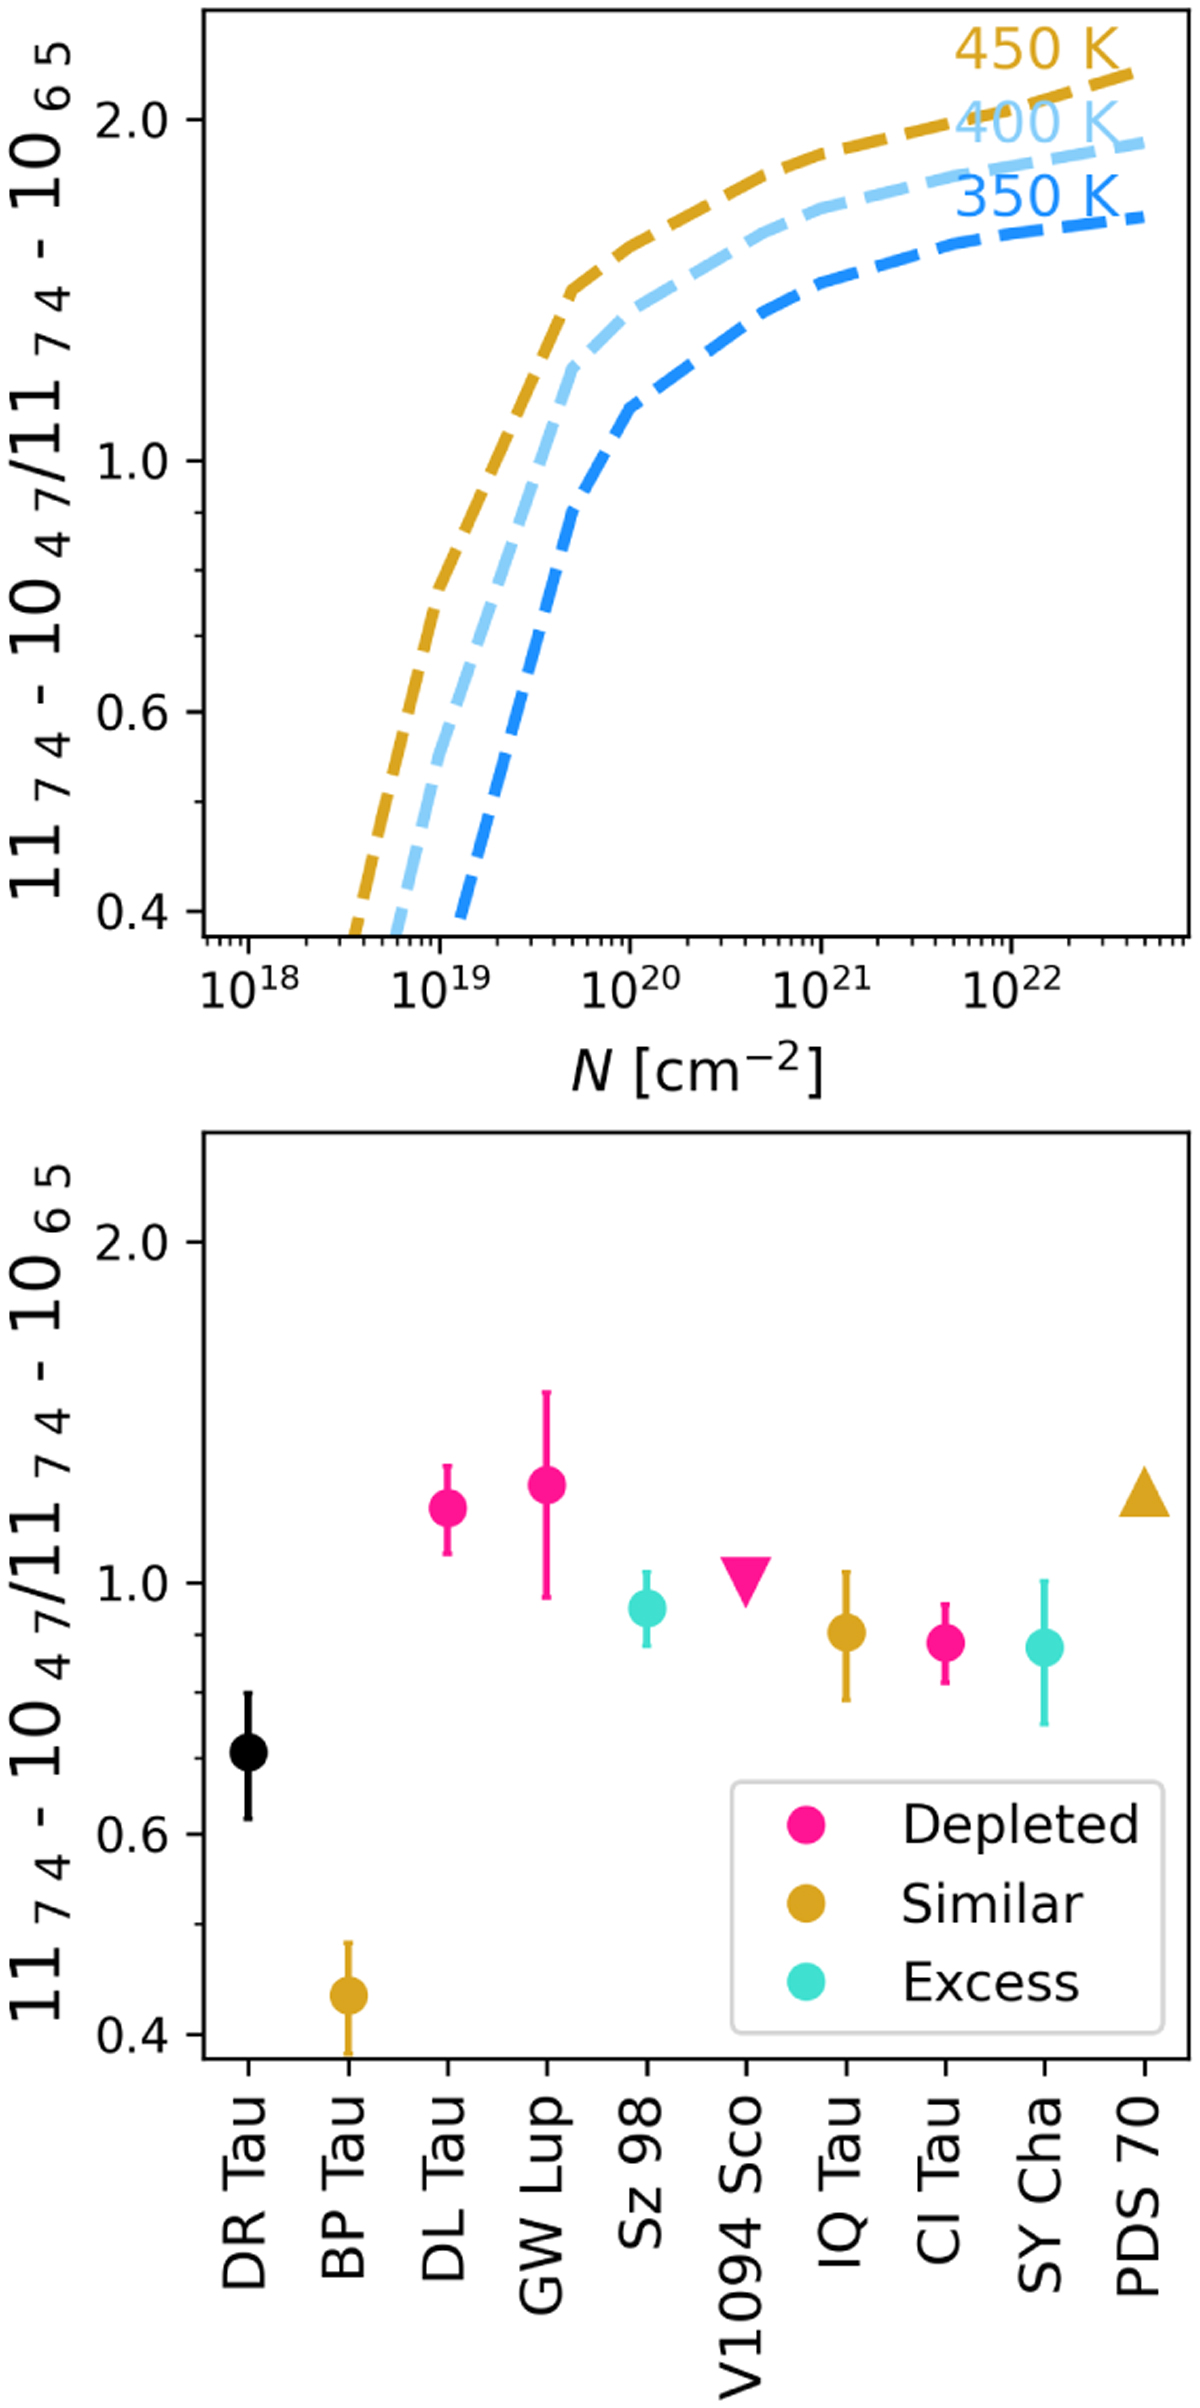
Line flux ratio of the column density tracer from slab models (top), and the same line pair ratio in the spectra (bottom). The colourcoding corresponds to the observed depletion and excesses in colder H2O compared to DR Tau (black point), where similar emission properties to DR Tau are indicated with gold markers, an excess cyan markers, and a depletion pink markers. In the top plot, the temperature effects on the line flux ratio are demonstrated. In V1094 Sco and PDS 70 we do not detect one of the lines of the cold pair. Therefore, the lower/upper limits are indicated by the triangles in the bottom panel.
Current usage metrics show cumulative count of Article Views (full-text article views including HTML views, PDF and ePub downloads, according to the available data) and Abstracts Views on Vision4Press platform.
Data correspond to usage on the plateform after 2015. The current usage metrics is available 48-96 hours after online publication and is updated daily on week days.
Initial download of the metrics may take a while.