Fig. 2
Download original image
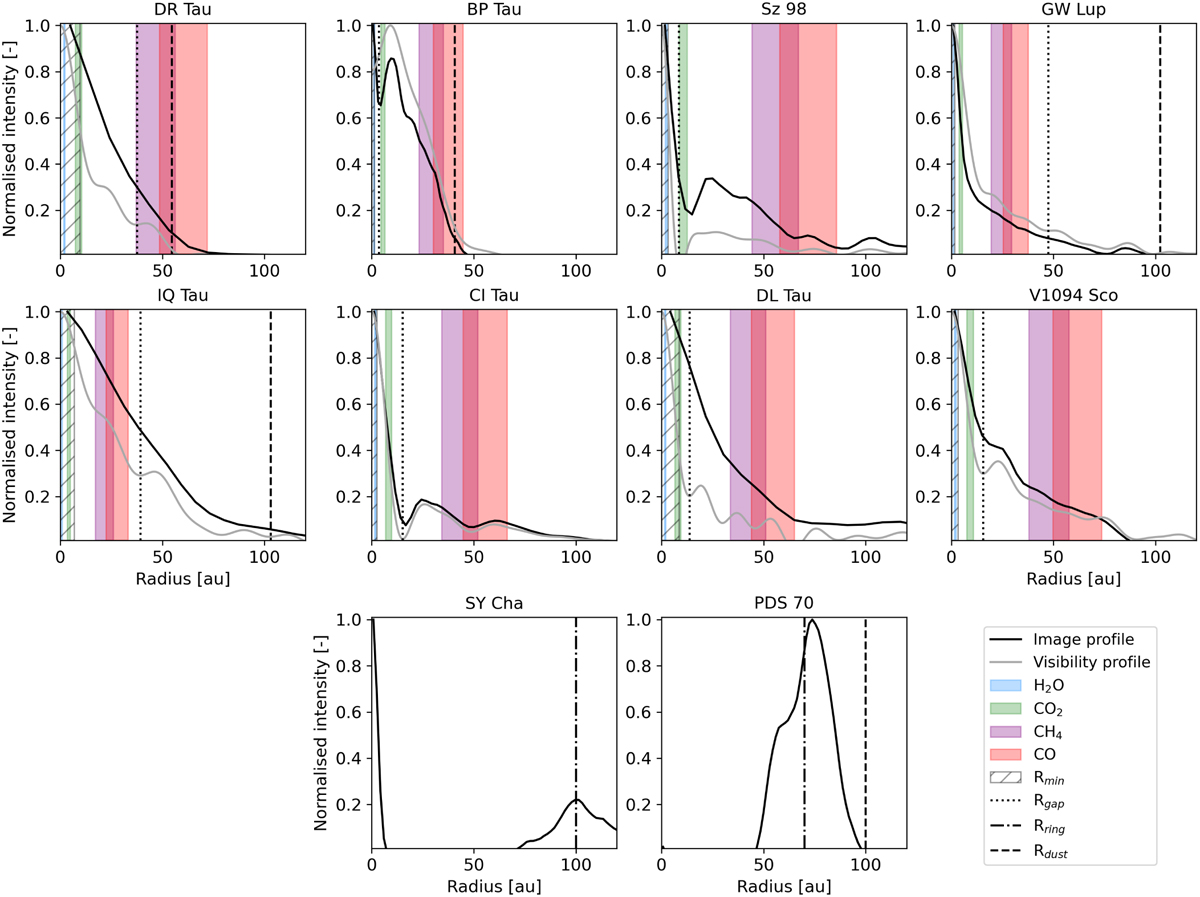
Radial profiles of the disc sample based on the analysis in the image (black line) and visibility plane (grey line). The snowline estimates of H2O, CO2, CH4, and CO are indicated by the coloured areas. The minimum distance from the star that can be imaged, based on half the beam radius, is indicated by the hatched area. The Rgap , or the location of the innermost detected local minimum, is indicated by the vertical dotted line. The discs are organised from strongest ![]() (top left) to weakest (bottom right), with the two (pre-)transition discs in the bottom row.
(top left) to weakest (bottom right), with the two (pre-)transition discs in the bottom row.
Current usage metrics show cumulative count of Article Views (full-text article views including HTML views, PDF and ePub downloads, according to the available data) and Abstracts Views on Vision4Press platform.
Data correspond to usage on the plateform after 2015. The current usage metrics is available 48-96 hours after online publication and is updated daily on week days.
Initial download of the metrics may take a while.