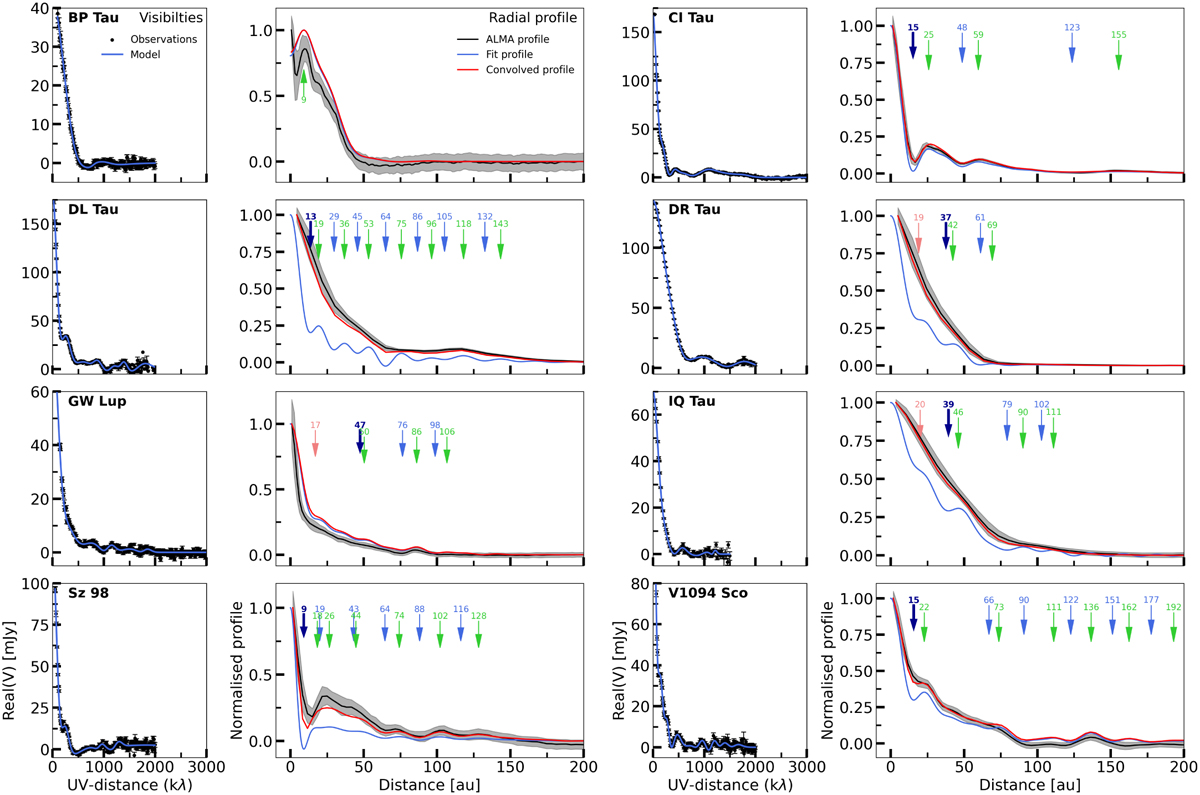
Fig. C.2
Download original image
Fit to the visibilities (blue line in the left panels for each source) and the various radial profiles (right panels): one from the ALMA image (black line), the model radial profile (blue line), and the radial profile from the model convolved with a Gaussian kernel tailored after the resolving beam (red line). The shaded grey area indicates the standard deviation in each radial bin of the ALMA profile. The gaps and rings (or local minima and maxima) and plateaus/shoulders are indicated by, respectively, the blue, green, and red arrows, where the values indicate their integer radial positions. The location of the innermost gap is emphasised by the dark blue arrows.
Current usage metrics show cumulative count of Article Views (full-text article views including HTML views, PDF and ePub downloads, according to the available data) and Abstracts Views on Vision4Press platform.
Data correspond to usage on the plateform after 2015. The current usage metrics is available 48-96 hours after online publication and is updated daily on week days.
Initial download of the metrics may take a while.