Fig. 1
Download original image
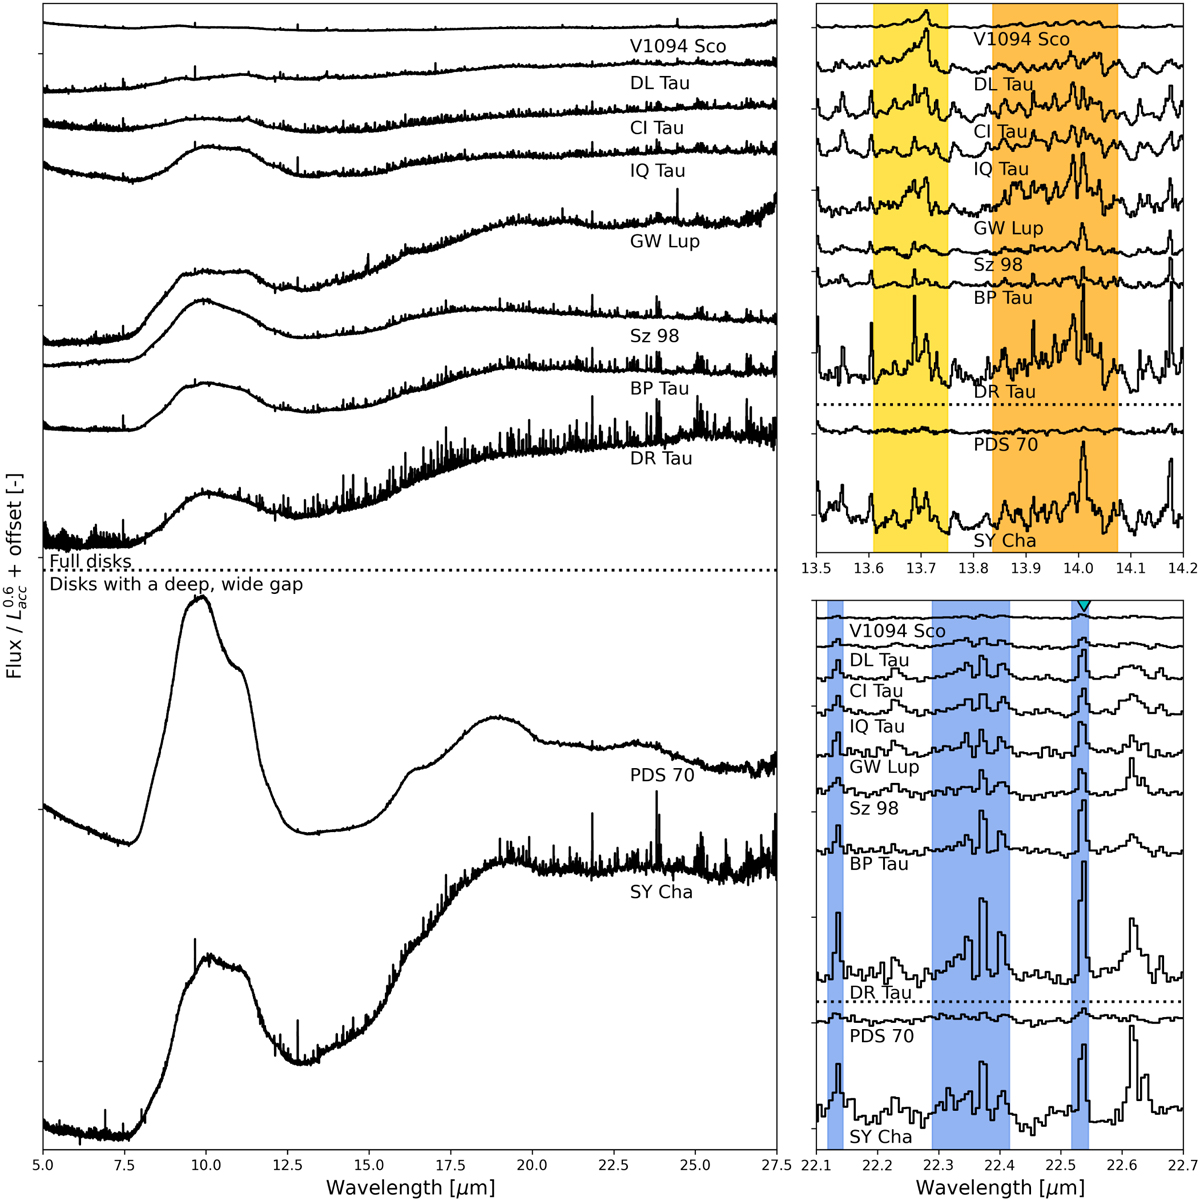
Spectra of all discs considered in this study. The fluxes have been rescaled with respect to distance and ![]() , the full discs are arranged from largest
, the full discs are arranged from largest ![]() (bottom), to smallest (top). The right column shows sections of the spectra with C2H2 (yellow shading) and HCN (orange shading) emission (top), and H2O (blue shading) emission (bottom). The triangle in the bottom right panel indicates the line in this wavelength region used to calculate the cold H2O flux. The shaded regions of C2H2 and HCN are also the regions over which the integrated fluxes are calculated.
(bottom), to smallest (top). The right column shows sections of the spectra with C2H2 (yellow shading) and HCN (orange shading) emission (top), and H2O (blue shading) emission (bottom). The triangle in the bottom right panel indicates the line in this wavelength region used to calculate the cold H2O flux. The shaded regions of C2H2 and HCN are also the regions over which the integrated fluxes are calculated.
Current usage metrics show cumulative count of Article Views (full-text article views including HTML views, PDF and ePub downloads, according to the available data) and Abstracts Views on Vision4Press platform.
Data correspond to usage on the plateform after 2015. The current usage metrics is available 48-96 hours after online publication and is updated daily on week days.
Initial download of the metrics may take a while.