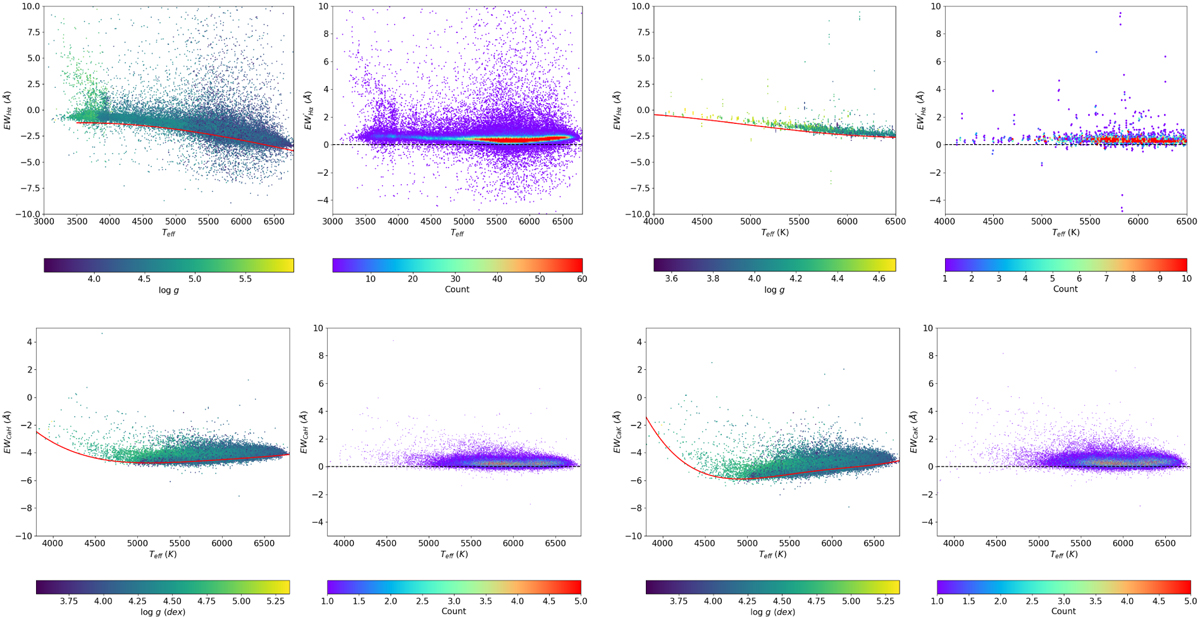
Fig. 4
Download original image
Baseline fits for EWHα (from both medium and low-resolution data), shown in the upper two panels, and the lower two panels show E WCaK and EWCaH (both from low-resolution data), along with the results after subtracting the baseline. The solid red line in the figure depicts the fitting line for the least active 2% of stars in the sample, while the black dashed line represents y=0. In the panel without subtracting the baseline, the color bar indicates the parameter log 𝑔. In the panel after subtracting the baseline, the color bar represents the number density.
Current usage metrics show cumulative count of Article Views (full-text article views including HTML views, PDF and ePub downloads, according to the available data) and Abstracts Views on Vision4Press platform.
Data correspond to usage on the plateform after 2015. The current usage metrics is available 48-96 hours after online publication and is updated daily on week days.
Initial download of the metrics may take a while.