Fig. 3
Download original image
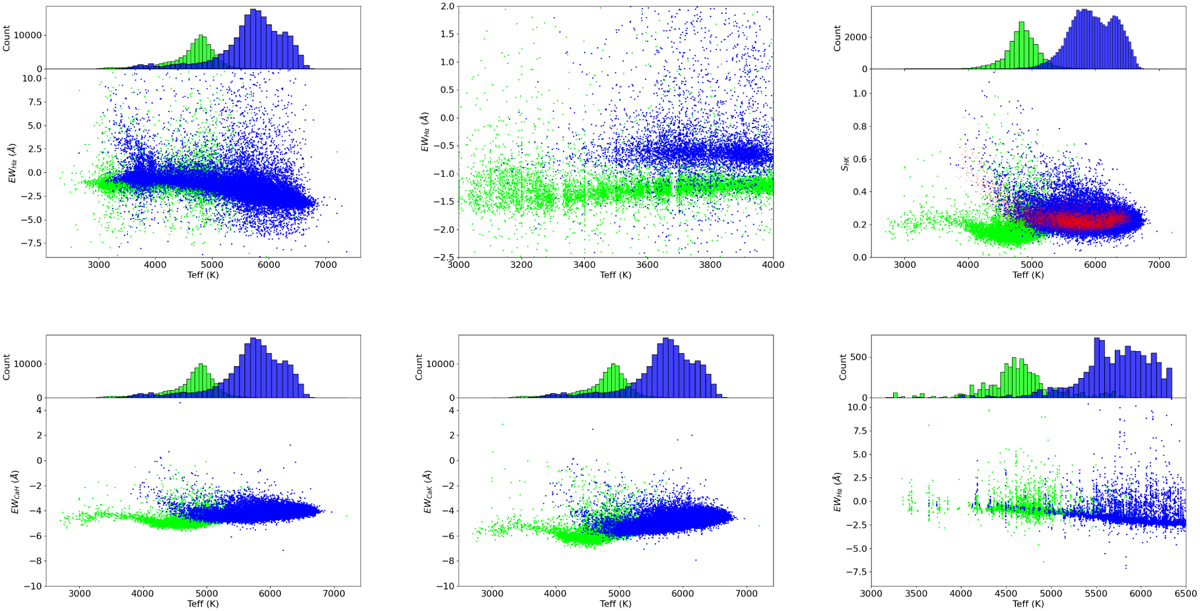
Results of EWHα for the low-resolution data and the results of the S-index (SHK) shown in the three upper panels. The left panel shows all the data, while the middle panel provides a magnified view of the results. The right panel shows SHK. The three lower panels display the results of EWCaH, EWCaK for the low-resolution data, and EWHα for the medium-resolution data. In each panel, blue dots represent main sequence stars, while green dots represent giants. The red dots in the SHK result panel are sourced from Zhang et al. (2020).
Current usage metrics show cumulative count of Article Views (full-text article views including HTML views, PDF and ePub downloads, according to the available data) and Abstracts Views on Vision4Press platform.
Data correspond to usage on the plateform after 2015. The current usage metrics is available 48-96 hours after online publication and is updated daily on week days.
Initial download of the metrics may take a while.