Fig. 1
Download original image
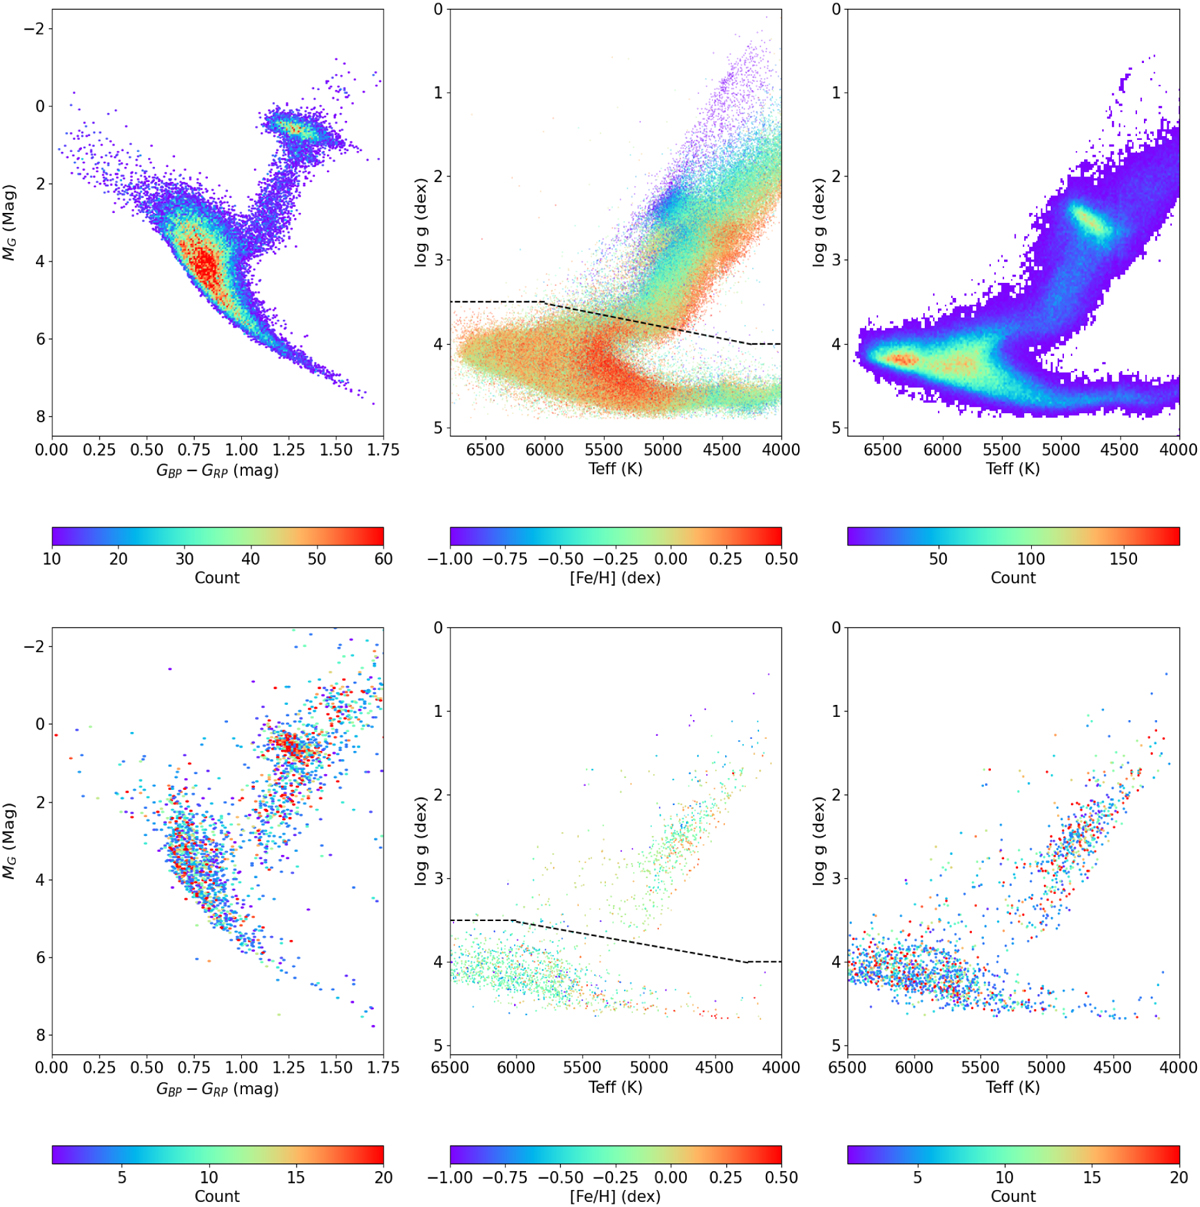
LAMOST DR10 low-resolution and medium-resolution samples in the ET 2.0 field, presented in the three panels above and the three panels below, respectively. The left, middle, and right panels of each set of images represent the relationship diagrams of different physical parameters. Left panel: HRD based on Gaia DR3 data. The color bar indicates the number density of stars. Middle panel: The relationship diagram between (Teff) and log 𝑔 based on LAMOST DR10 data, with the color bar representing the parameter [Fe/H]. The black dashed line represents the empirical formula proposed by Ciardi et al. (2011). Dividing the samples into giant stars (above the line) and main-sequence stars (below the line). Right panel: relationship diagram between (Teff) and log g based on LAMOST DR10 data, with the color bar indicating the number density of stars.
Current usage metrics show cumulative count of Article Views (full-text article views including HTML views, PDF and ePub downloads, according to the available data) and Abstracts Views on Vision4Press platform.
Data correspond to usage on the plateform after 2015. The current usage metrics is available 48-96 hours after online publication and is updated daily on week days.
Initial download of the metrics may take a while.