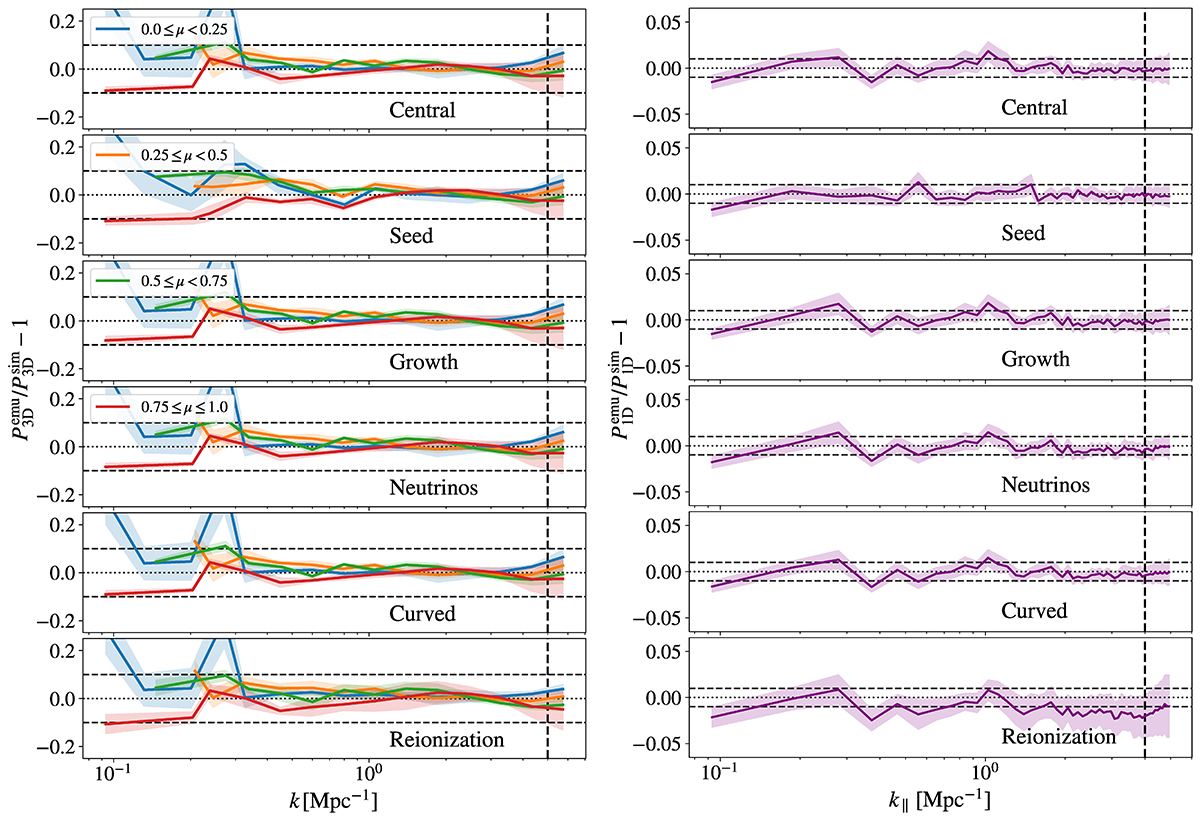
Fig. 7.
Download original image
Performance of FORESTFLOW in recovering P3D and P1D for test simulations not included in the training set. Lines and shaded areas display the average and standard deviation of the results for 11 snapshots between z = 2 and 4.5, respectively. From top to bottom, the rows show the results for the CENTRAL, SEED, GROWTH, NEUTRINOS, CURVED, and REIONISATION simulations, where the CENTRAL and SEED simulations are at the center of the input parameter space and employ the same and different initial distribution of Fourier phases as the training simulations, respectively, the GROWTH and REIONISATION simulations use a different growth and reionization history relative to those used by the TRAINING simulations, and the NEUTRINOS and CURVED simulations consider massive neutrinos and curvature. The efficiency of FORESTFLOW is approximately the same for all simulations.
Current usage metrics show cumulative count of Article Views (full-text article views including HTML views, PDF and ePub downloads, according to the available data) and Abstracts Views on Vision4Press platform.
Data correspond to usage on the plateform after 2015. The current usage metrics is available 48-96 hours after online publication and is updated daily on week days.
Initial download of the metrics may take a while.