Fig. A.2.
Download original image
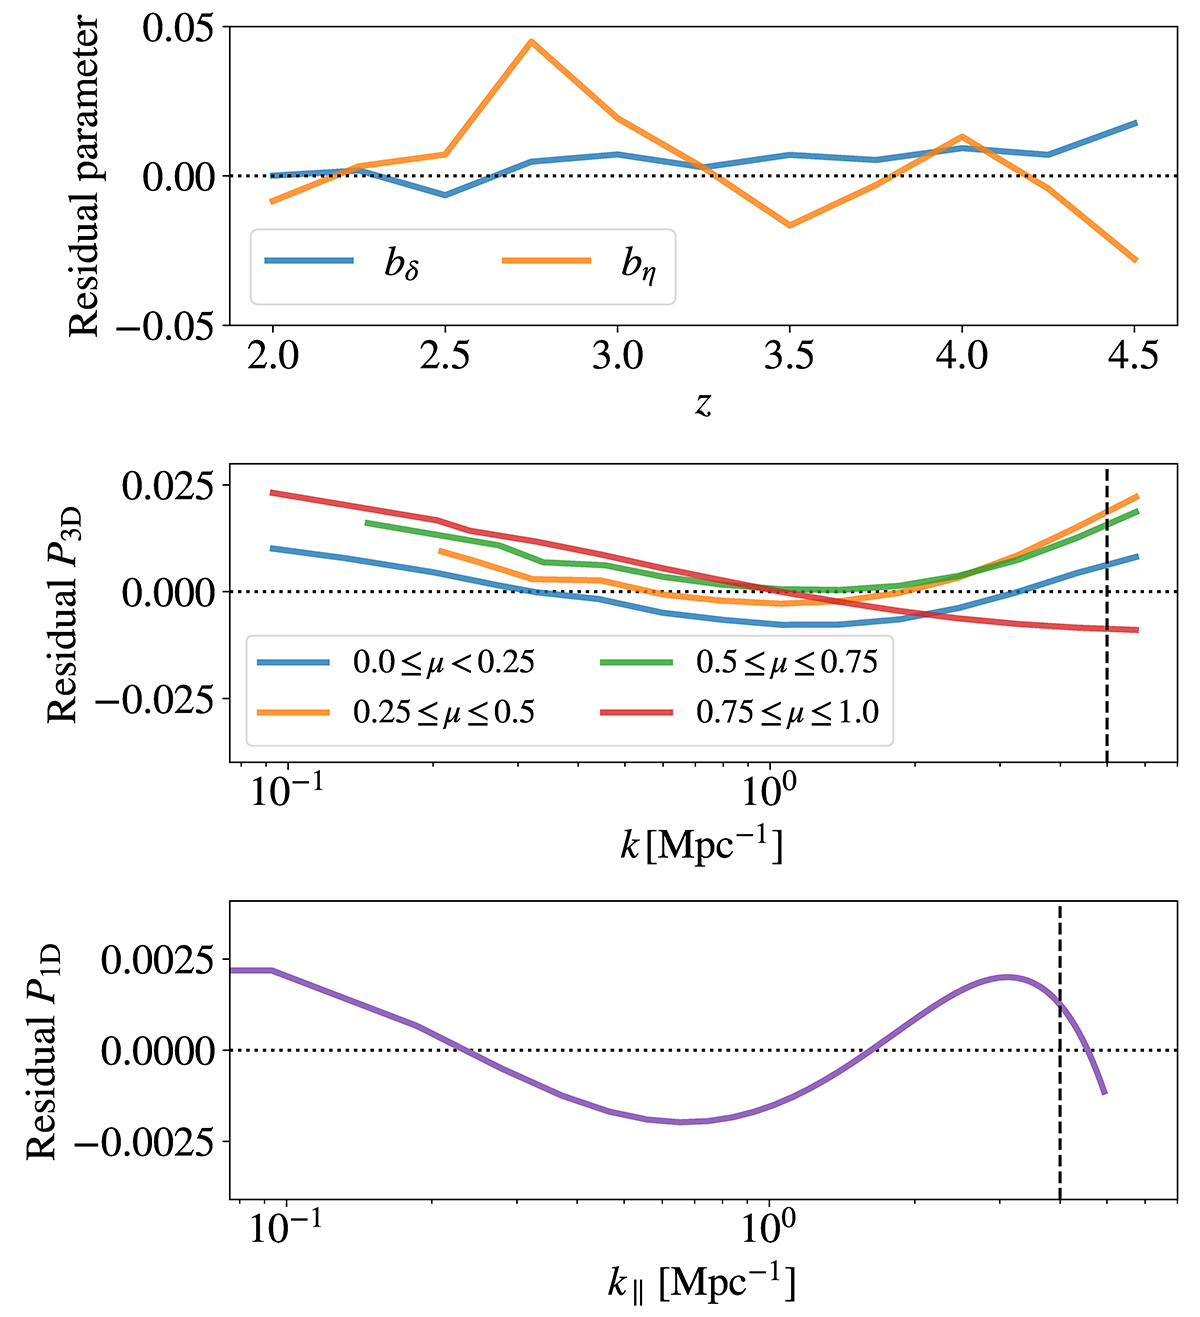
Impact of cosmic variance on predictions from the parametric model. Lines show the difference between the best-fitting models to P3D and P1D measurements from the CENTRAL and SEED simulations, divided by ![]() times the best-fitting model to their average. The top panel shows the results for the Lyman-α linear biases (bδ and bη), while the middle and bottom panels display the results for P3D and P1D at z = 3, respectively. The impact of cosmic variance on model predictions is approximately an order of magnitude smaller than on simulation measurements (see Fig. A.1).
times the best-fitting model to their average. The top panel shows the results for the Lyman-α linear biases (bδ and bη), while the middle and bottom panels display the results for P3D and P1D at z = 3, respectively. The impact of cosmic variance on model predictions is approximately an order of magnitude smaller than on simulation measurements (see Fig. A.1).
Current usage metrics show cumulative count of Article Views (full-text article views including HTML views, PDF and ePub downloads, according to the available data) and Abstracts Views on Vision4Press platform.
Data correspond to usage on the plateform after 2015. The current usage metrics is available 48-96 hours after online publication and is updated daily on week days.
Initial download of the metrics may take a while.