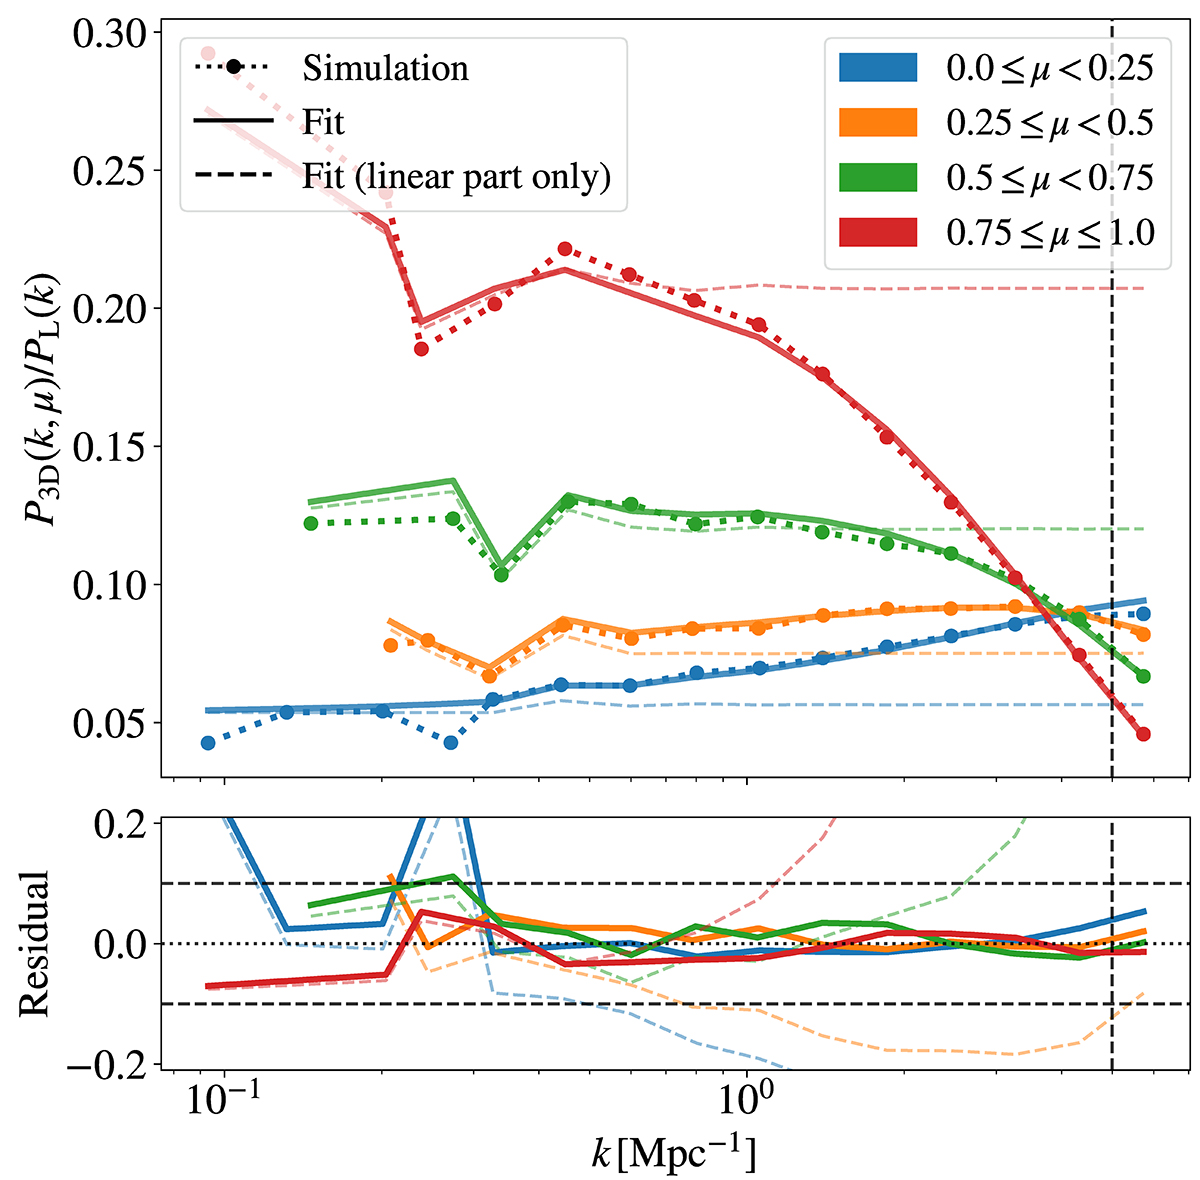
Fig. 1.
Download original image
Accuracy of the P3D model (see Eqs. (3) and (4)) in reproducing measurements from the CENTRAL simulation at z = 3. In the top panel, dotted and solid lines show the ratio of simulation measurements and model predictions relative to the linear power spectrum, respectively. Dashed lines do so for the linear part of the best-fitting model (DNL = 1). Line colors correspond to different μ wedges, and vertical dashed lines mark the minimum scale used for computing the best-fitting model, k = 5 Mpc−1. The bottom panel displays the relative difference between the best-fitting model and simulation measurements. The overall accuracy of the model is 2% on scales in which simulation measurements are not strongly affected by cosmic variance (k > 0.5 Mpc−1; see text).
Current usage metrics show cumulative count of Article Views (full-text article views including HTML views, PDF and ePub downloads, according to the available data) and Abstracts Views on Vision4Press platform.
Data correspond to usage on the plateform after 2015. The current usage metrics is available 48-96 hours after online publication and is updated daily on week days.
Initial download of the metrics may take a while.