Fig. 6.
Download original image
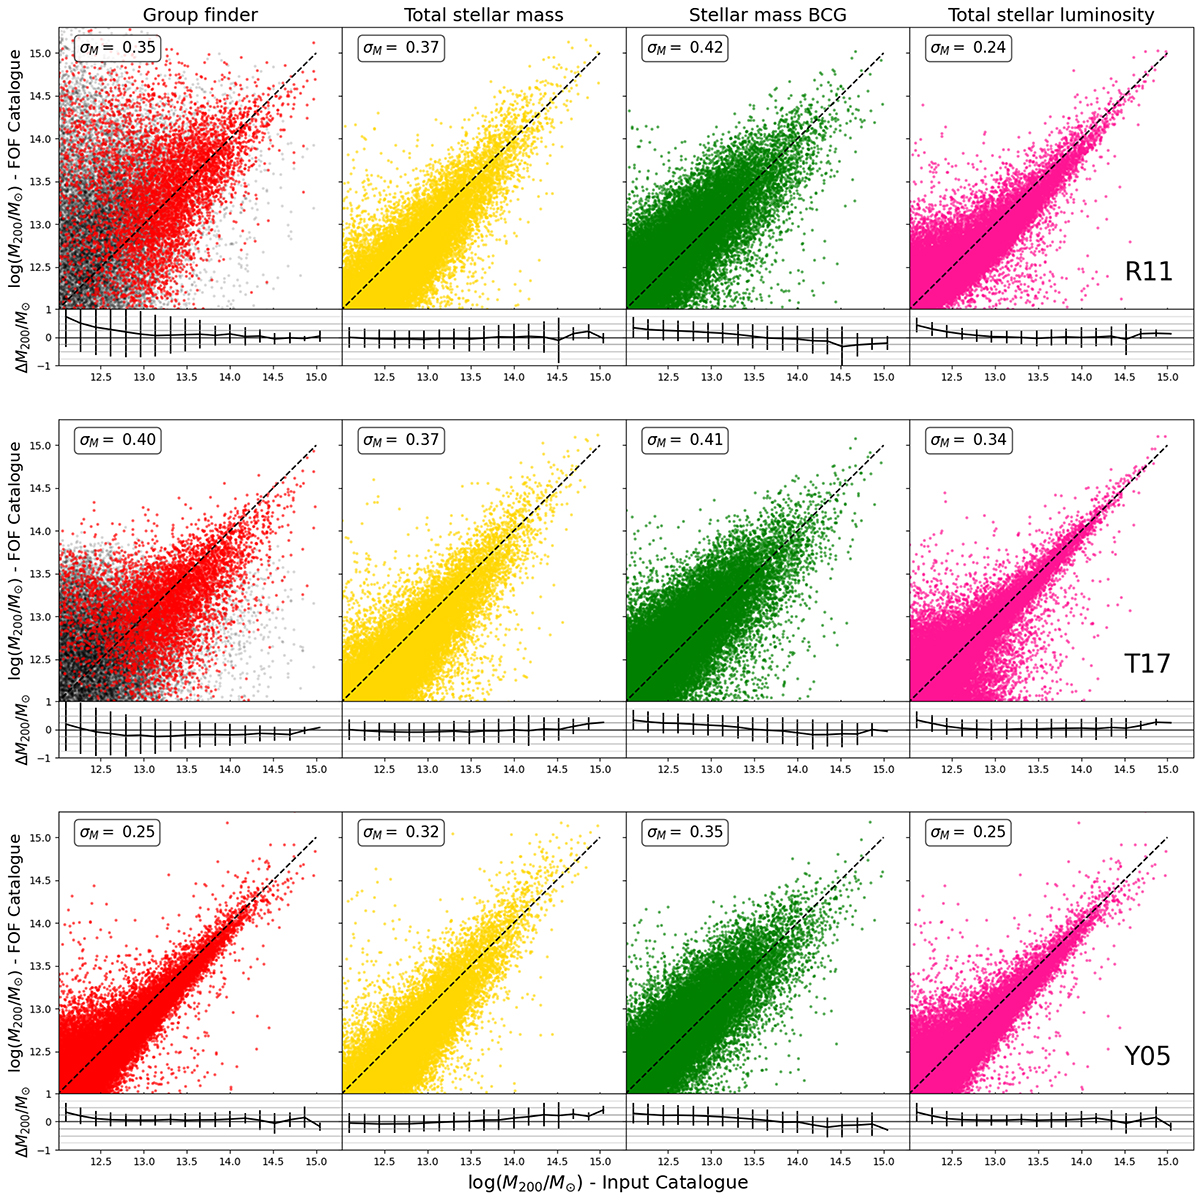
Comparison of estimated halo mass in the FOF catalogues as function of true input mass from Magneticum. Each row represents the results from the different group finders: R11, T17, and Y05 from top to bottom. Each panel reports a different halo-mass proxy. The algorithm developed by R11 and T17 estimates the halo mass based on the members’ velocity dispersion; thus we show the distribution of points based on their richness (i.e. at least four members are the coloured points) in their panels. Points are the primary detections. Y05 uses the total stellar luminosity to probe the halo mass; therefore, there is no richness limit. We note that in Y05 the first panel and last thus display the same data. For each distribution, we include a bottom rectangular panel with the scatter (mean and standard deviation) in bins of the true Magneticum’s halo mass. In the text at the top, we report the total mean scatter (in dex). The dashed black line marks the 1:1 relation.
Current usage metrics show cumulative count of Article Views (full-text article views including HTML views, PDF and ePub downloads, according to the available data) and Abstracts Views on Vision4Press platform.
Data correspond to usage on the plateform after 2015. The current usage metrics is available 48-96 hours after online publication and is updated daily on week days.
Initial download of the metrics may take a while.