Fig. A.1.
Download original image
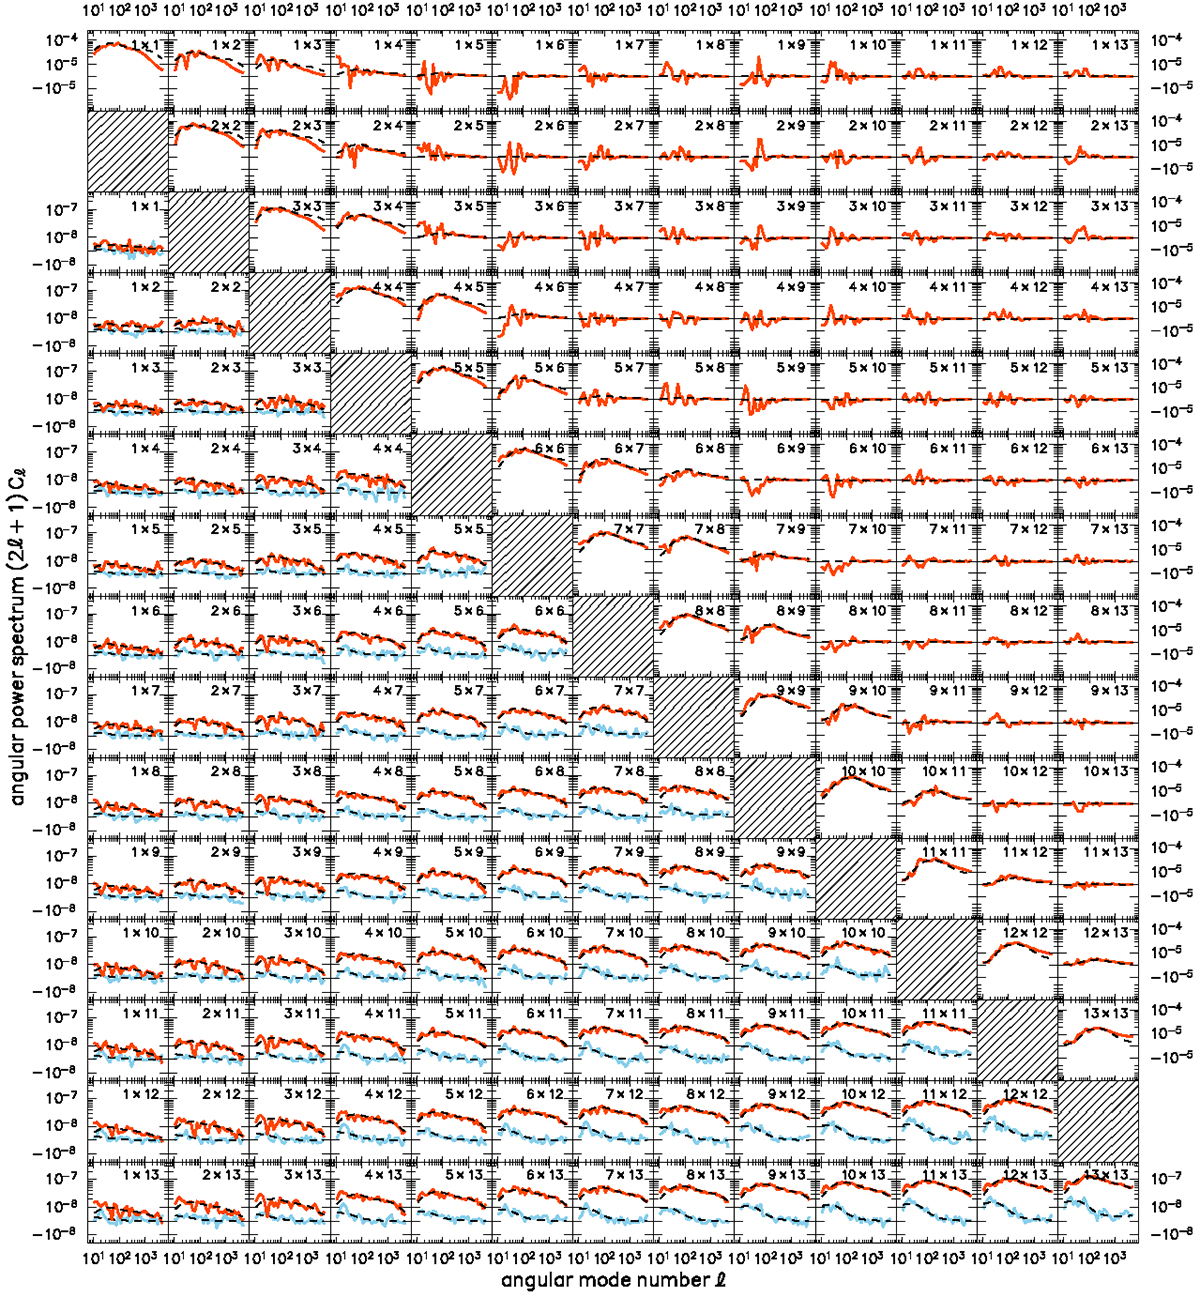
Angular power spectra (red) for angular clustering (upper triangle) and cosmic shear (lower triangle) in the Euclid Flagship simulation with a DR1-like footprint. For cosmic shear, the B-mode spectrum due to mode mixing is shown in blue. Also shown is the expectation for each spectrum (dashed), as computed from the respective mixing matrices. All spectra are binned into 32 angular bins with logarithmic spacing between l = 10 and l = 5000. The y-axis changes to linear scaling when passing through the origin.
Current usage metrics show cumulative count of Article Views (full-text article views including HTML views, PDF and ePub downloads, according to the available data) and Abstracts Views on Vision4Press platform.
Data correspond to usage on the plateform after 2015. The current usage metrics is available 48-96 hours after online publication and is updated daily on week days.
Initial download of the metrics may take a while.