Fig. 9
Download original image
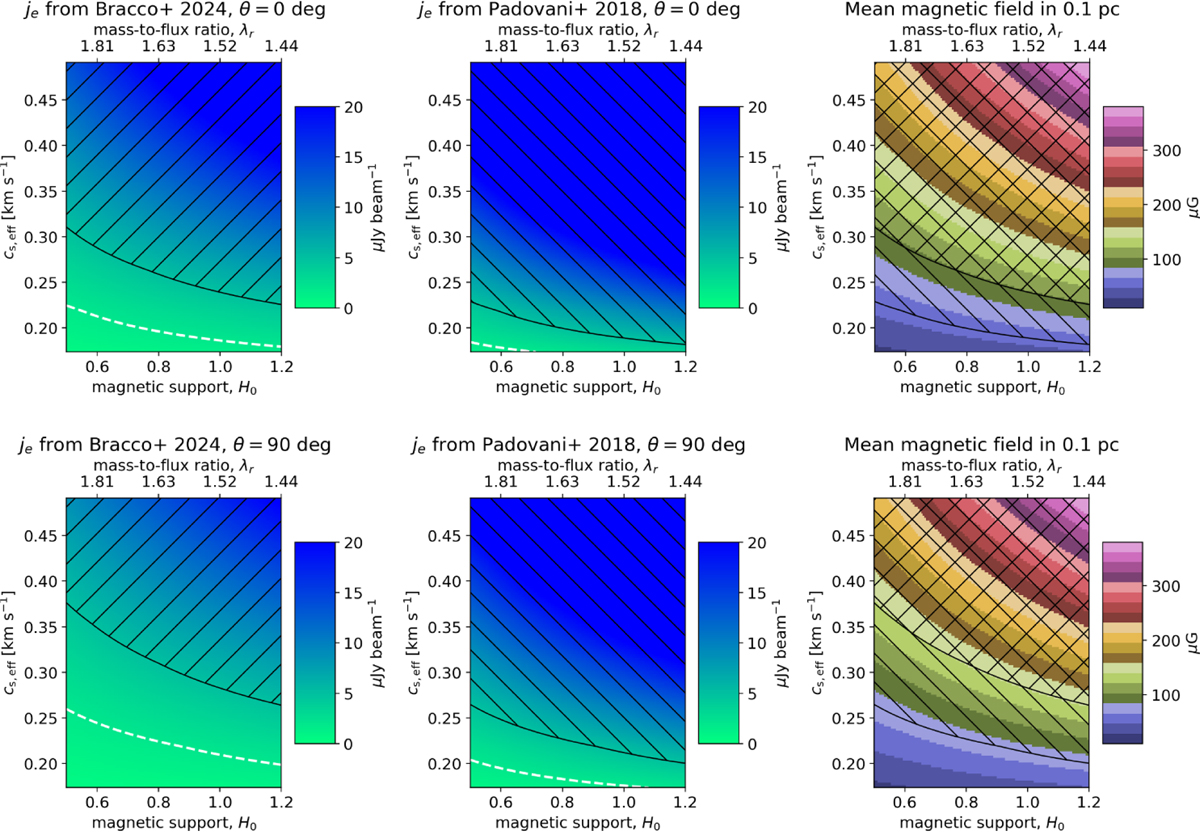
Estimated Stokes I at 144 MHz from a grid of prestellar-core models – see one example in Fig. 8 – as a function of the magnetic support (H0) and the effective sound speed in the medium (cs,eff). The corresponding mass-to-flux ratio (λr) is also displayed on the top of each panel. In the left and central panels, two different emissivity models are considered (Padovani et al. 2018; Bracco et al. 2024). In the right panels, for each pair of parameters (cs,eff, H0), we show the corresponding magnetic-field strength averaged within 0.1 pc from the center. In the two rows we integrate the models either edge-on (top) or face-on (bottom). Black hatches define the non-detection areas in the LOFAR data for Stokes I values greater than 5 μJy beam−1. The dashed white lines at 2 μJy beam−1 indicate the sensitivity in Perseus of SKA-Low for ~9 hours of observations in stage AA* and ~4 hours in stage AA4.
Current usage metrics show cumulative count of Article Views (full-text article views including HTML views, PDF and ePub downloads, according to the available data) and Abstracts Views on Vision4Press platform.
Data correspond to usage on the plateform after 2015. The current usage metrics is available 48-96 hours after online publication and is updated daily on week days.
Initial download of the metrics may take a while.