Fig. 6
Download original image
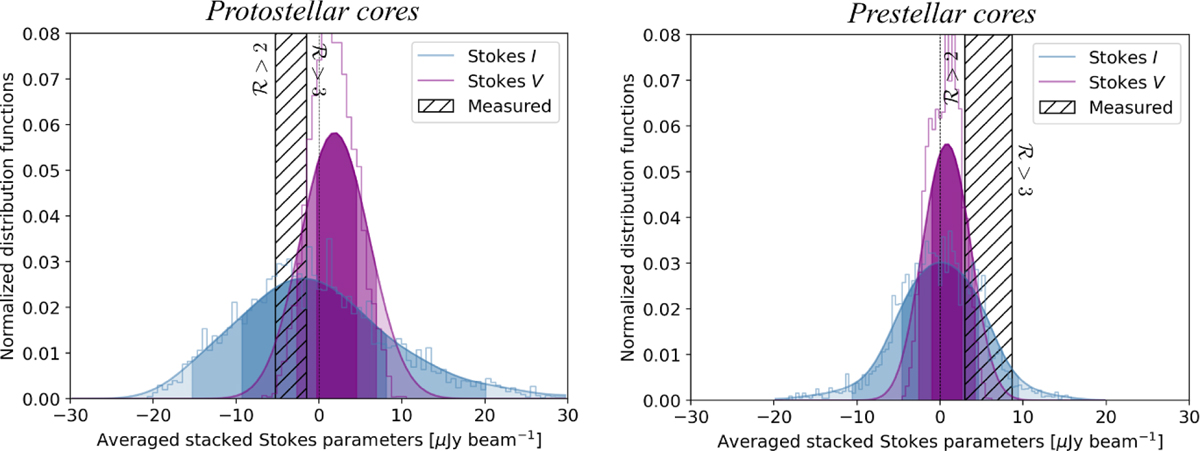
Normalized distribution functions for protostellar (left) and prestellar (right) cores of the residual stacked Stokes-I (blue) and -V (purple) maps averaged within 5000 circles of equal area as the central black circle in Figs. 3 and 5. The measured values at the center are shown with diagonal black hatches depending on the choice of ℛ for defining the outlier cores. From dark to light colours, shadows correspond to 1-, 2-, and 3-σ levels. The 84 th percentiles are 8 μJy beam−1 and 5 μJy beam−1 for protostellar and prestellar cores, respectively. The NDF are shown with both histograms and kernel density estimates.
Current usage metrics show cumulative count of Article Views (full-text article views including HTML views, PDF and ePub downloads, according to the available data) and Abstracts Views on Vision4Press platform.
Data correspond to usage on the plateform after 2015. The current usage metrics is available 48-96 hours after online publication and is updated daily on week days.
Initial download of the metrics may take a while.