Fig. 4
Download original image
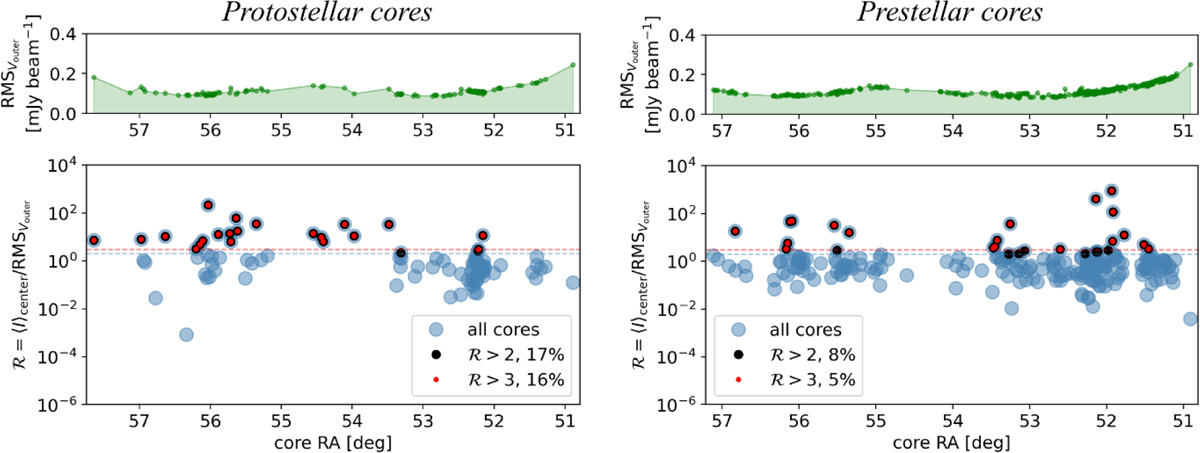
Ratio (ℛ) between the mean of Stokes I within the central region (black circle in Fig. 3) and the RMS value of Stokes V in the outer region (see top panels), for prestellar (right) and protostellar (left) cores. ℛ is shown as a function of the RA coordinate of each core. The selected sources correspond to ℛ values greater than 2 (black dots above the dashed blue line) and 3 (red dots above the dashed red line).
Current usage metrics show cumulative count of Article Views (full-text article views including HTML views, PDF and ePub downloads, according to the available data) and Abstracts Views on Vision4Press platform.
Data correspond to usage on the plateform after 2015. The current usage metrics is available 48-96 hours after online publication and is updated daily on week days.
Initial download of the metrics may take a while.