Fig. 7

Download original image
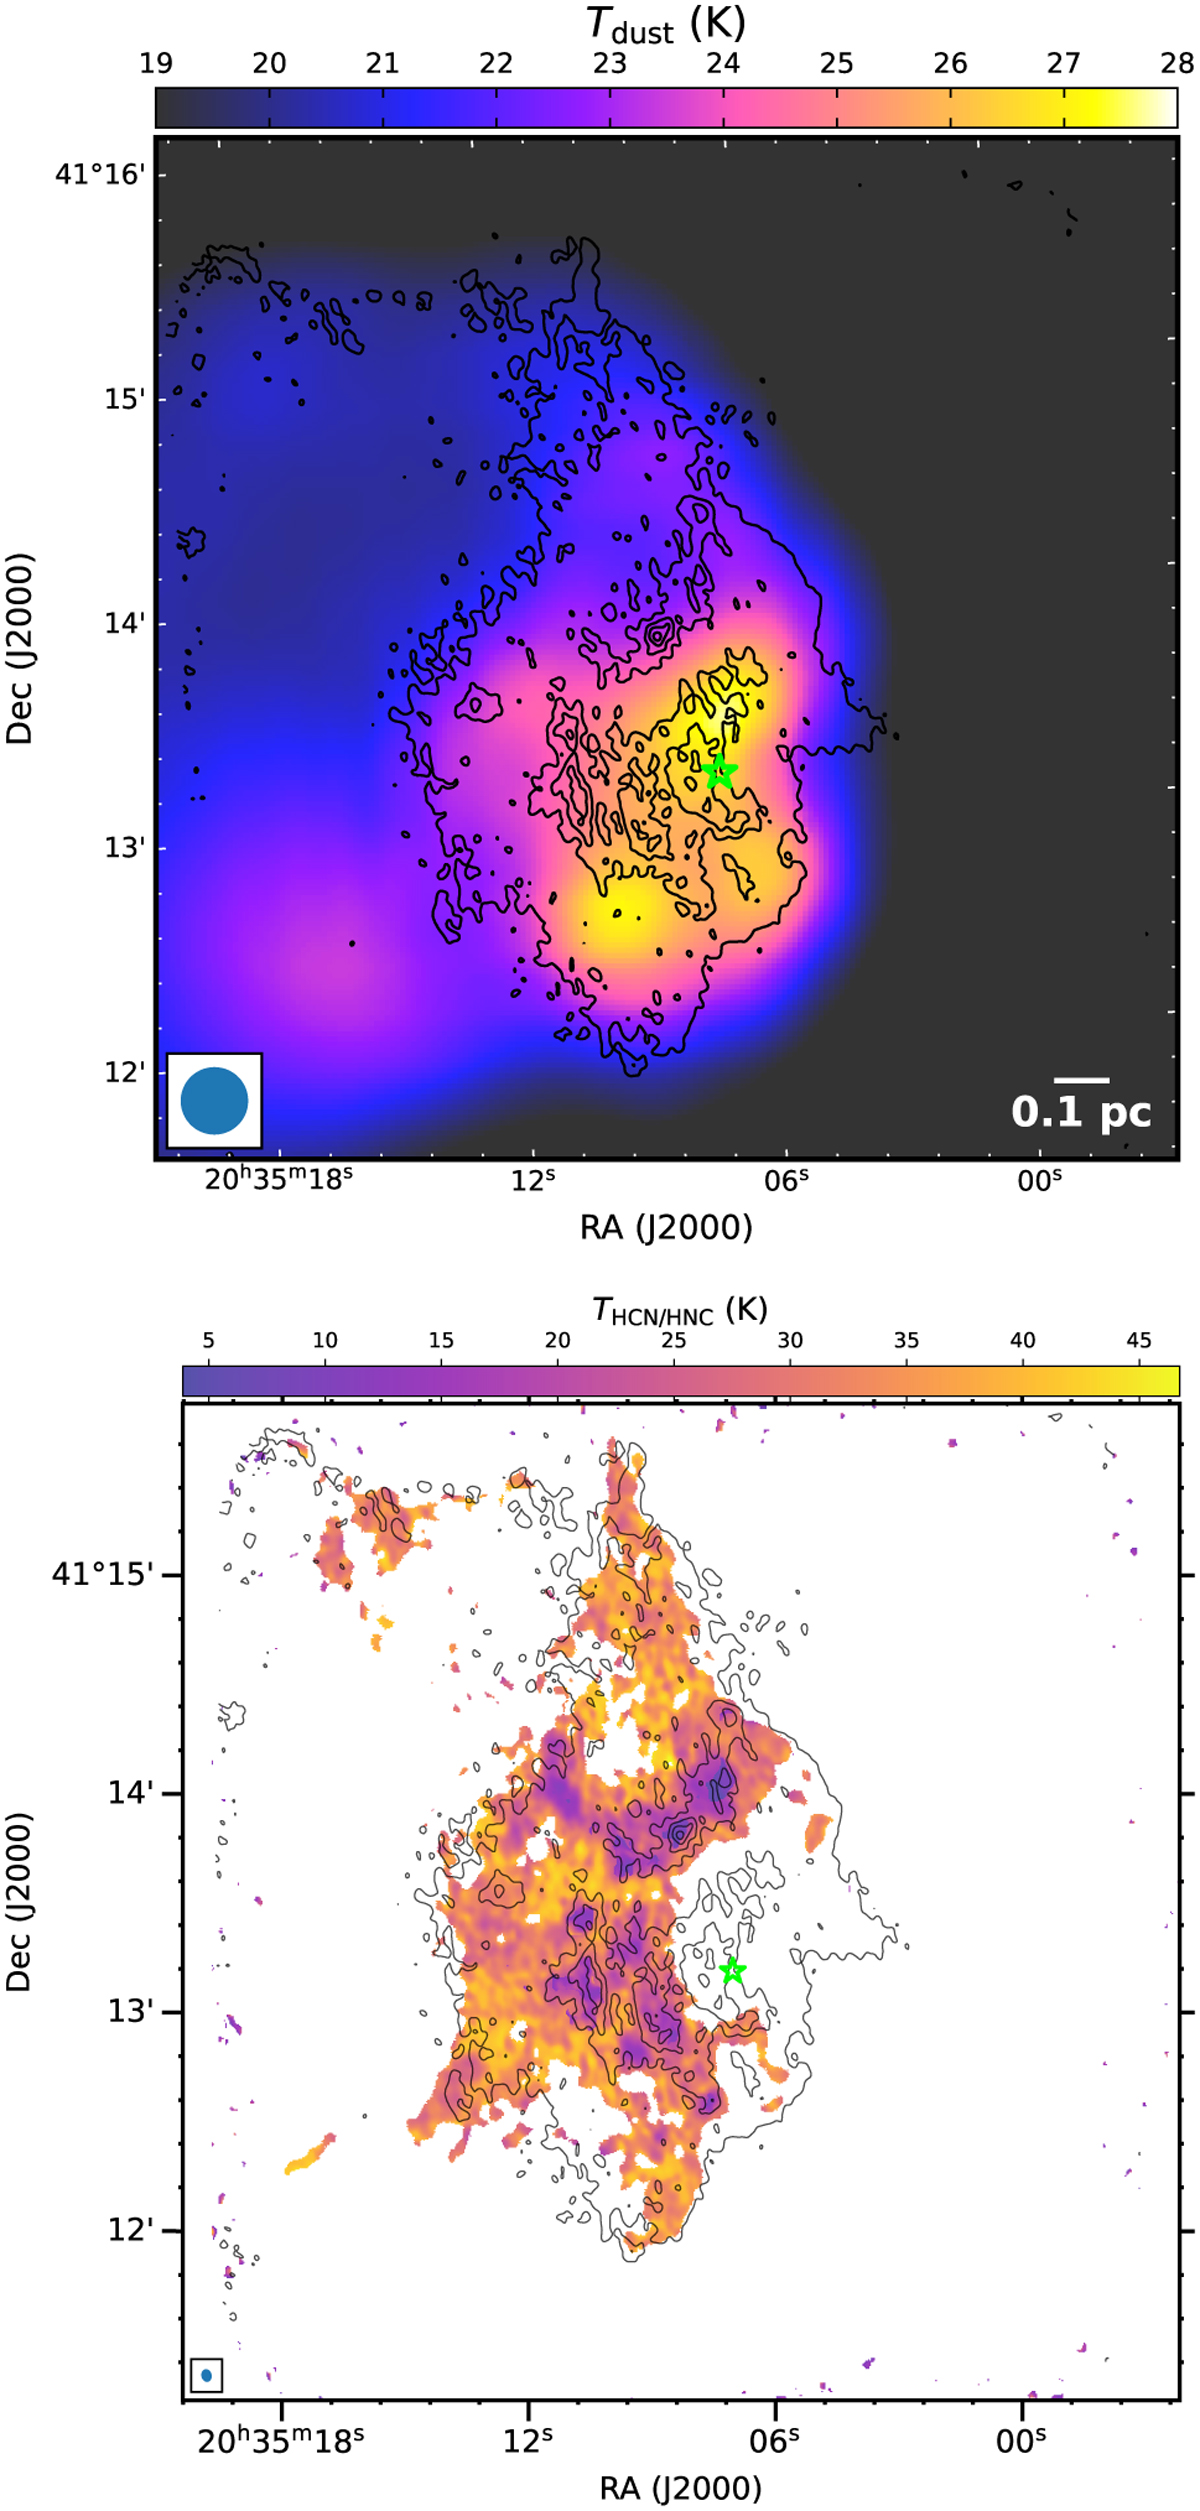
Dust and gas temperature maps. Top: dust temperature map obtained from Bonne et al. (2023) generated with the 160 µm/250µm flux density ratio as described in the work by Palmeirim et al. (2013). Bottom: gas kinetic temperature map combined temperature maps derived from the HCN/HNC and H13CN/HN13C emission line ratios. The black contours represent the 3.6 mm continuum emission. The bright green star indicates the position of the B2-type star D18-05. The beams for the Tdust and THCN/HNC maps are 18″ and 3.43 × 2.76 with a position angle of 13.66° displayed in the lower left corner.
Current usage metrics show cumulative count of Article Views (full-text article views including HTML views, PDF and ePub downloads, according to the available data) and Abstracts Views on Vision4Press platform.
Data correspond to usage on the plateform after 2015. The current usage metrics is available 48-96 hours after online publication and is updated daily on week days.
Initial download of the metrics may take a while.


