Fig. 3
Download original image
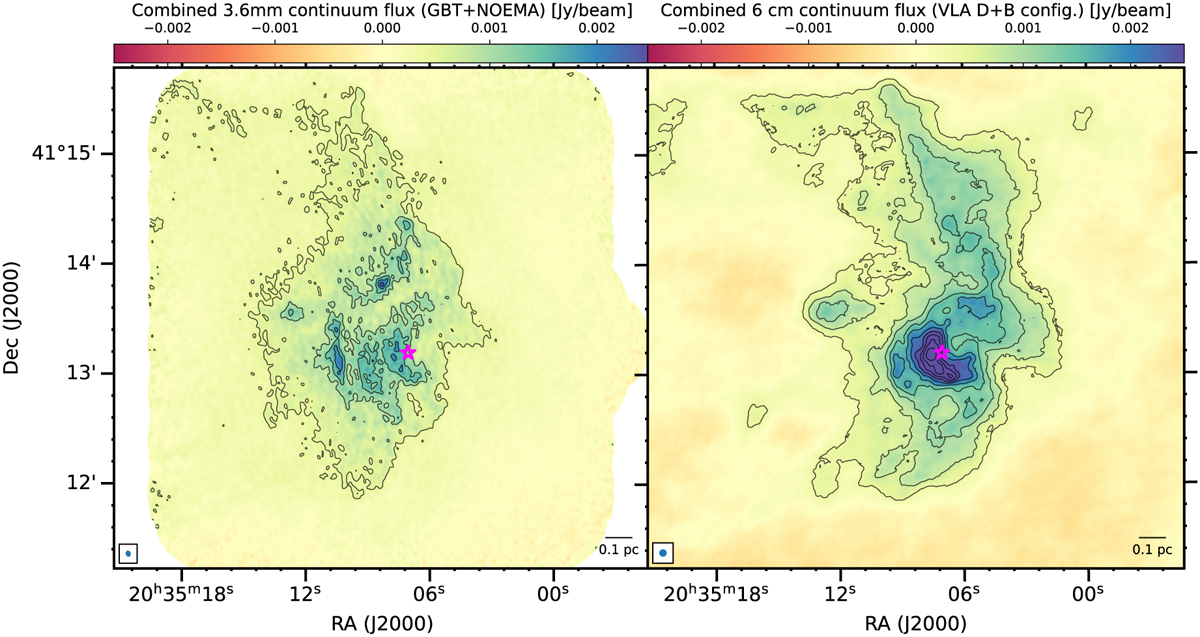
Millimeter (left) and centimeter (right) continuum emission maps. The mm continuum emission map represents the combination of the GBT MUSTANG2 and NOEMA data sets, whereas the cm continuum emission map is generated by combining the VLA D and B configuration observations. The FWHM synthetic beams of these maps are displayed in the lower left corners. The contour levels of the mm continuum emission are 0.46, 0.96, 1.38, 1.80, 4.14, 5.33, and 6.51 mJy beam–1, whereas for the cm emission, the levels are 0.35, 0.70, 1.05, 1.40, 1.75, 2.10, 2.45, 2.80, 3.15, and 3.50 mJy beam–1. The star symbol indicates the position of the B2 star.
Current usage metrics show cumulative count of Article Views (full-text article views including HTML views, PDF and ePub downloads, according to the available data) and Abstracts Views on Vision4Press platform.
Data correspond to usage on the plateform after 2015. The current usage metrics is available 48-96 hours after online publication and is updated daily on week days.
Initial download of the metrics may take a while.