Fig. 2
Download original image
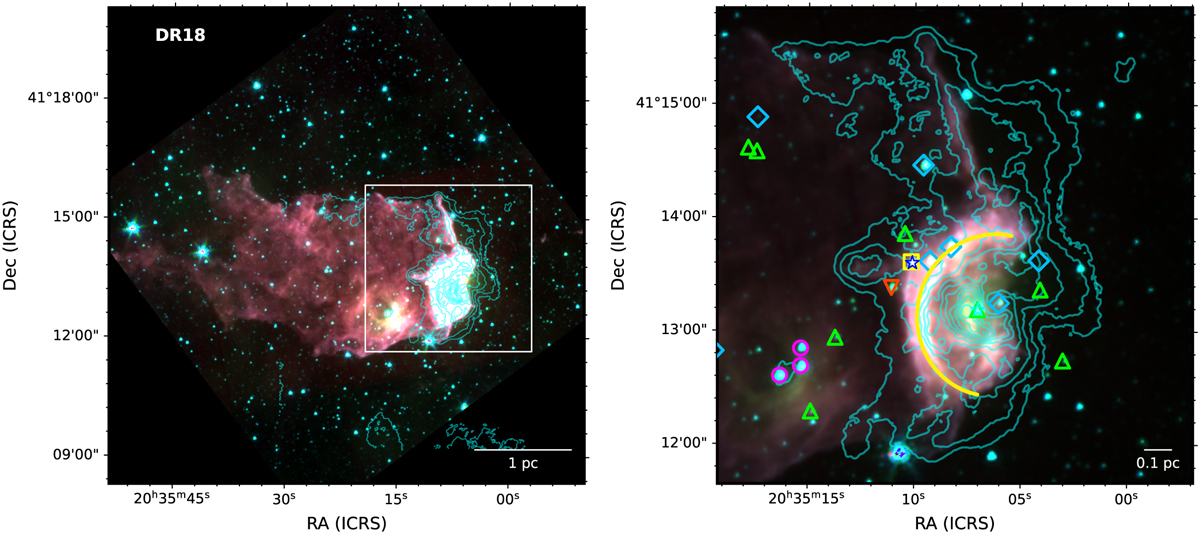
Three-color composite images of DR18 (8 µm in red, 4.5 µm in green, and 3.6 µm in blue) with different maximum flux levels for three Spitzer/IRAC bands to show the extended emission in a larger FoV (left panel) and the emission details, which are saturated in the left panel, in a zoom-in view (right panel) covering our 5.1′ × 5.1′ target region (outlined by a white square box in the large FoV image). In both images, cyan contour lines represent the combined VLA B+D array 6 cm radio continuum emission from the GLOSTAR survey by levels of 0.35, 0.70, 1.05, 1.40, 1.75, 2.10, 2.45, 2.80, 3.15, and 3.50 mJy/beam. In the zoom-in image, the different color symbols indicate young stellar objects identified by infrared colors (Comerón et al. 2022): yellow squares mark Class I YSOs, light blue diamonds for Class II YSOs, red upside-down triangle for a flat spectrum YSO, purple circles for Class III YSOs, and bright green upside triangles represent transition-disk YSOs. The yellow half-arc line indicates the open shell or the ear-like feature in the infrared emission image.
Current usage metrics show cumulative count of Article Views (full-text article views including HTML views, PDF and ePub downloads, according to the available data) and Abstracts Views on Vision4Press platform.
Data correspond to usage on the plateform after 2015. The current usage metrics is available 48-96 hours after online publication and is updated daily on week days.
Initial download of the metrics may take a while.