Fig. 15
Download original image
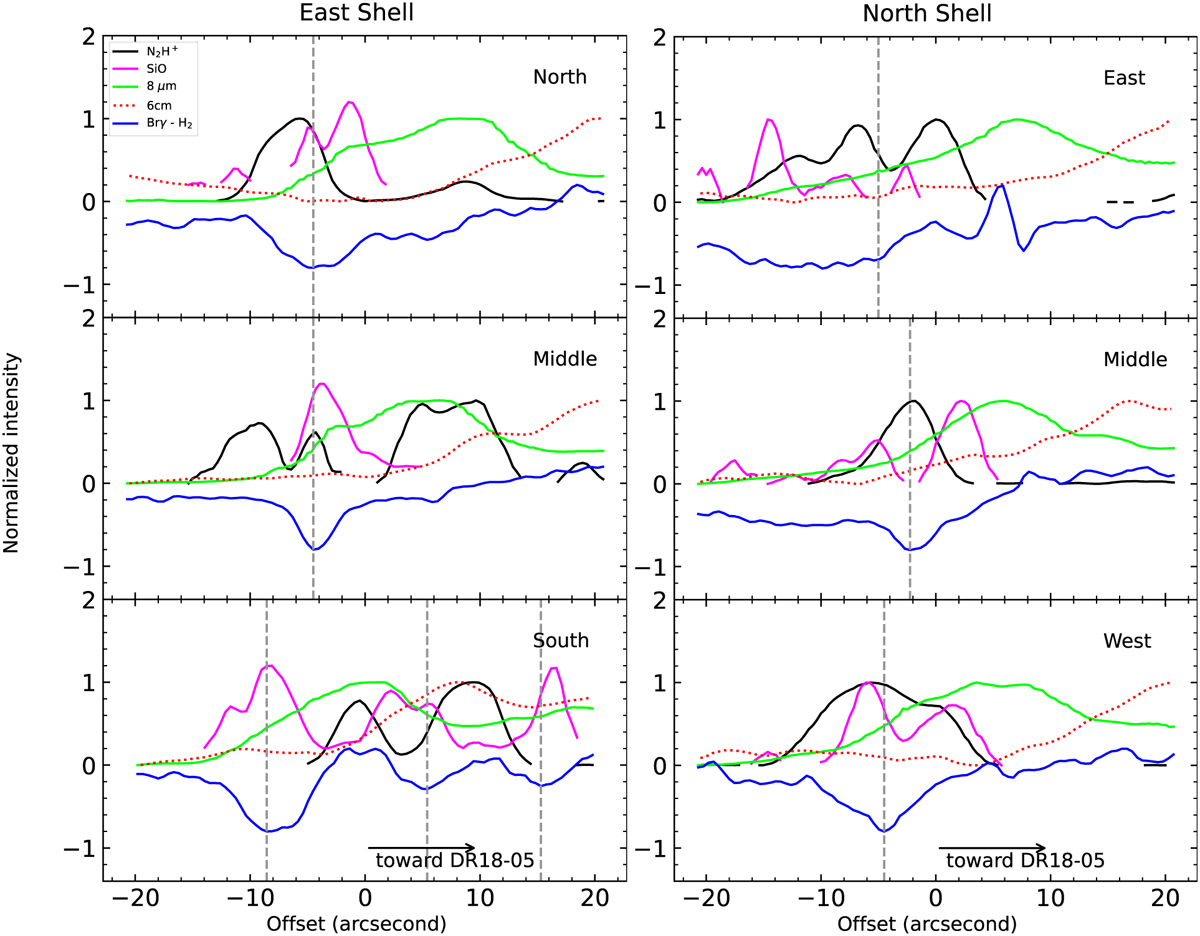
Intensity profiles of different tracers (see legend in the top left panel) along different cuts through the eastern shell (left column) and the northern shell (right column). All the molecular line intensities were extracted from their velocity-integrated intensity maps. The extents and directions of the cuts are shown in the left three-color image of Fig. 12. For improved visibility, the Brγ-H2 intensity profiles are shifted by −0.8, while the SiO profiles are moved by +0.2 along the y-axis. The vertical dashed lines indicate the depths in the intensity profiles of Brγ-H2.
Current usage metrics show cumulative count of Article Views (full-text article views including HTML views, PDF and ePub downloads, according to the available data) and Abstracts Views on Vision4Press platform.
Data correspond to usage on the plateform after 2015. The current usage metrics is available 48-96 hours after online publication and is updated daily on week days.
Initial download of the metrics may take a while.