Fig. 12
Download original image
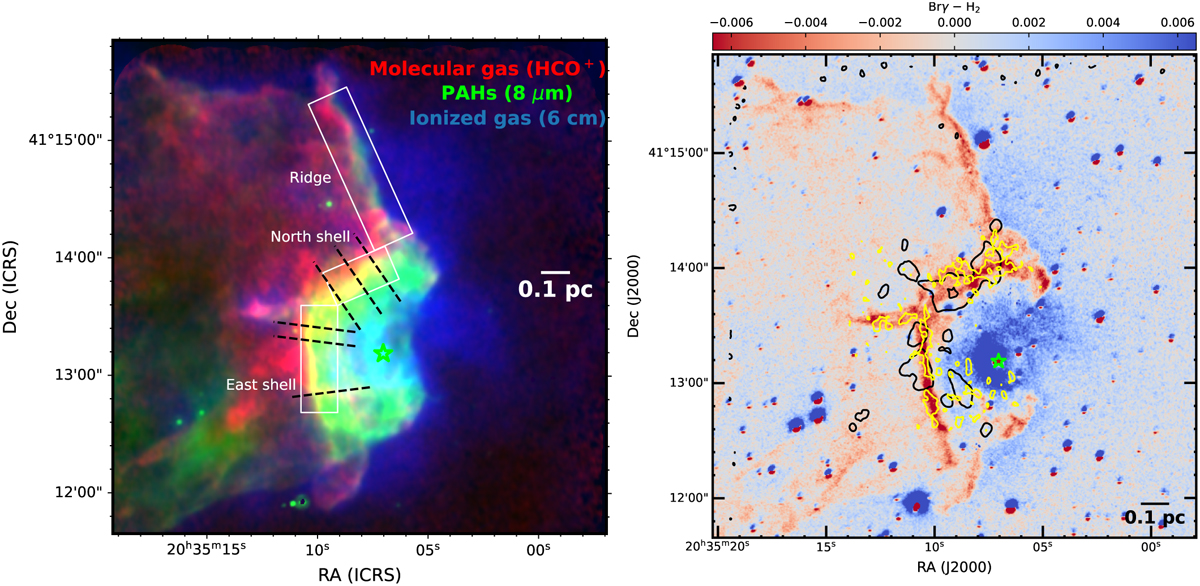
Different emission distributions toward DR18. Left: three-color composite image of DR18; HCO+ emission in red, 8 µm emission in green, and the GLOSTAR 6 cm radio continuum emission in blue. The 6 cm emission represents a combination VLA D- and B-configuration data from the GLOSTAR survey. The synthesized beam size of the GLOSTAR data is 4″, comparable to that of NOEMA data (~3–4″). The pixel size, of the Spitzer/IRAC 8 µm data is 0.″6. The black dashed lines indicate the cuts for intensity profiles of different emission tracers, presented in Fig. 15. The white rectangles represent the areas of the East and North shells, as well as the Ridge. Right: flux difference image of Brγ and H2 1–0 S (1) emission lines obtained from Comerón et al. (2022). The black and yellow contours show the 5σ level of N2H+ velocity-integrated intensity and a 3.0σ level of SiO velocity-integrated intensity, respectively. In both images, the bright green star indicates DR18-05, the ionizing source in DR18.
Current usage metrics show cumulative count of Article Views (full-text article views including HTML views, PDF and ePub downloads, according to the available data) and Abstracts Views on Vision4Press platform.
Data correspond to usage on the plateform after 2015. The current usage metrics is available 48-96 hours after online publication and is updated daily on week days.
Initial download of the metrics may take a while.