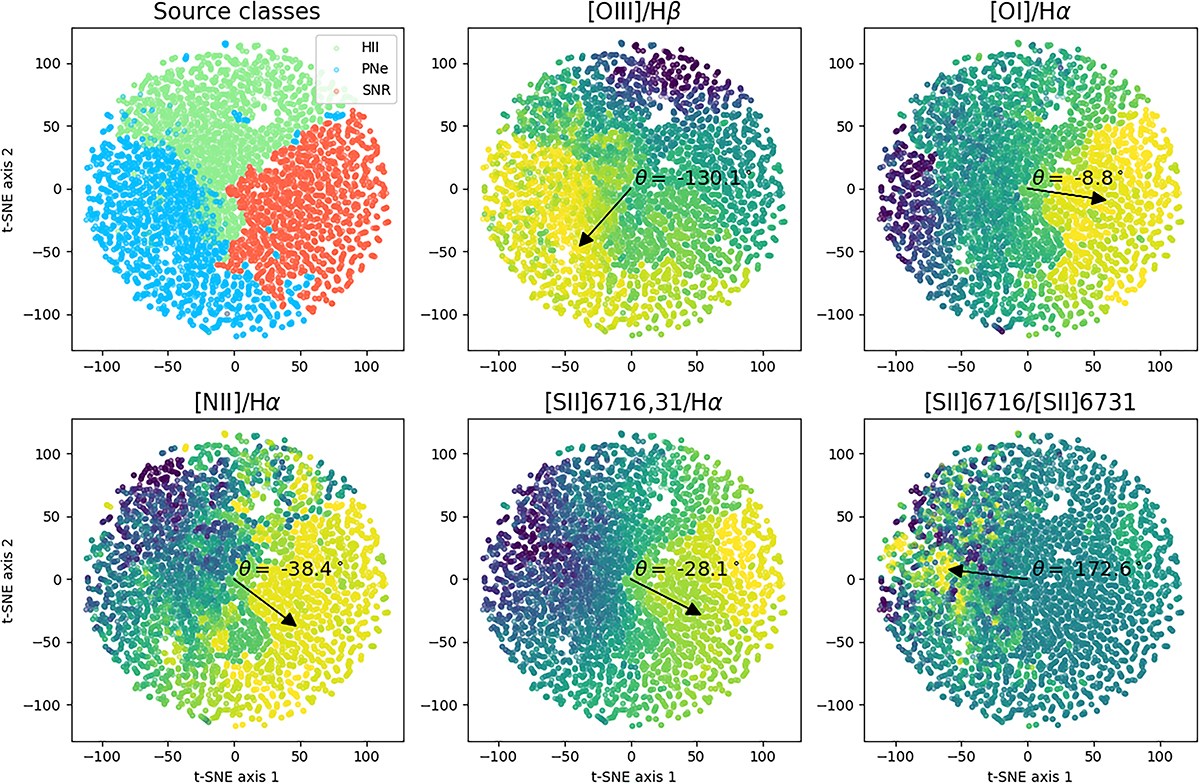
Fig. 8.
Download original image
Two-dimensional representations of the DANN embeddings (a representative model with S/N ∼ 40) colour-coded by the source domain classes, and various line ratios (which are either the input features themselves or a combination of input features), shown as the titles of each panel. The colourbar goes from blue (low) to yellow (high) and in each panel is normalised to the 2nd and 98th percentiles of the quantity. The arrow emerging from the origin shows the direction of steepest increase in the colour-coded quantity, measured clockwise from the positive x-axis.
Current usage metrics show cumulative count of Article Views (full-text article views including HTML views, PDF and ePub downloads, according to the available data) and Abstracts Views on Vision4Press platform.
Data correspond to usage on the plateform after 2015. The current usage metrics is available 48-96 hours after online publication and is updated daily on week days.
Initial download of the metrics may take a while.