| Issue |
A&A
Volume 692, December 2024
|
|
|---|---|---|
| Article Number | A103 | |
| Number of page(s) | 6 | |
| Section | Interstellar and circumstellar matter | |
| DOI | https://doi.org/10.1051/0004-6361/202450998 | |
| Published online | 06 December 2024 | |
First discovery and confirmation of planetary nebula candidates from AI and deep learning techniques applied to VPHAS+ survey data
1
The Department of Physics, The University of Hong Kong,
Hong Kong
SAR,
China
2
The Laboratory for Space Research, The University of Hong Kong,
Hong Kong
999077,
China
3
College of Electronic Information and Optical Engineering, Taiyuan University of Technology,
Taiyuan
030024,
China
4
Peng Cheng Lab,
Shenzhen
518066,
China
★ Corresponding author; This email address is being protected from spambots. You need JavaScript enabled to view it.
Received:
5
June
2024
Accepted:
3
October
2024
Abstract
Context. We have developed tools based on deep learning and artificial intelligence (AI) to search extant narrow-band wide-field Hα surveys of the Galactic Plane for elusive planetary nebulae (PNe) hidden in dense star fields towards the Galactic centre. They are faint, low-surface-brightness, usually resolved sources, which had not discovered by previous automatic searches that depend on photometric data for point-like sources. These sources are very challenging to locate by traditional visual inspection in such crowded fields and many have been missed. We have successfully adopted a novel ‘Swin-Transformer’ AI algorithm, which we describe in detail in the preceding Techniques paper (Paper I).
Aims. Here, we present preliminary results from our first spectroscopic follow-up run for 31 top-quality PN candidates found by the algorithm from the high-resolution Hα survey VPHAS+. This survey has not yet undergone extensive manual, systematic searching.
Methods. Our candidate PNe were observed with the SpUpNIC spectrograph on the 1.9 m telescope at the South African Astronomical Observatory (SAAO) in June 2023. We performed standard IRAF spectroscopic reduction, followed by our normal HASH PN identification and classification procedures.
Results. Our reduced spectra confirmed that these candidates include 22 true, likely, and possible PNe (70.97%), 3 emission-line galaxies, 2 emission-line stars, 2 late-type star contaminants, and 2 other Hα sources including a newly identified detached fragment of supernova remnants (SNRs) RCW 84. We present the imaging and spectral data of these candidates and a preliminary analysis of their properties. These data provide strong input for evaluating and refining the behaviour of the AI algorithm when searching for PNe in wide-field Hα surveys.
Key words: methods: data analysis / techniques: spectroscopic / planetary nebulae: general
© The Authors 2024
 Open Access article, published by EDP Sciences, under the terms of the Creative Commons Attribution License (https://creativecommons.org/licenses/by/4.0), which permits unrestricted use, distribution, and reproduction in any medium, provided the original work is properly cited.
This article is published in open access under the Subscribe to Open model. This email address is being protected from spambots. You need JavaScript enabled to view it. to support open access publication.
1 Introduction
A planetary nebula (PN) is a brief but crucial stage in the late stage evolution of low- to intermediate-mass stars. Their properties can reveal the physics of stellar nucleosynthesis and mass-loss processes occurring during this phase (e.g. Iben 1995), Galactic chemical enrichment and any Galactic abundance gradients (Maciel et al. 2003; Henry et al. 2010; Maciel et al. 2015; Stanghellini & Haywood 2018). As one of the most complex and beautiful astrophysical object classes to study, a PN is the final, ejected gaseous envelope from its central star (CSPN) after the asymptotic giant branch (post-AGB) phase. These envelopes are ionised by the high-energy radiation emitted by the CSPN as it evolves towards becoming a white dwarf (WD). They experience dramatic evolution over cosmological short periods of time from typically ~21 000 ± 5000 years (Jacob et al. 2013; Badenes et al. 2015), although an even older example of a PN in an open cluster is estimated at an age of ~50 000 years (Fragkou et al. 2022). This brevity makes them rare. They exhibit a diverse range of properties, including morphology, size, surface brightness distribution, ionisation characteristics, elemental abundances, densities, and expansion rates related to the mass, temperature and properties of the CSPN. Overall, PNe can be easily confused with other objects, such as H II regions, young stellar objects (YSOs), supernova remnants (SNRs), Wolf-Rayet shells, nova shells, stellar-ejecta, and symbiotic systems, as described in Frew & Parker (2010) and Parker (2022). Such shared characteristics among various types of nebulae can cause difficulties in hunting for them with automatic software, which generally offers a better performance when applied to more regular targets, such as stars and galaxies. With the advent of deep, wide-field Hα surveys of the Galactic plane in the past 20 years, such as SHS (Parker et al. 2005) in the south and IPHAS (Drew et al. 2005) in the north, a remarkable contribution of 50% to the ~3800 currently known Galactic PNe (Parker et al. 2016) was made based on a visual examination from Hα narrow-band images, contrasted with corresponding red broad-band images. This discovery was reported in a major series of papers led by (and including) the second author of the present work (Parker et al. 2006; Miszalski et al. 2008; Sabin et al. 2014).
The most recent high-resolution Hα survey VPHAS+ (Drew et al. 2014) of the southern galactic plane, using the VST telescope in Chile, completed 91.6% of its planned footprint up to August 2018 with a coverage of ~2000 square degrees. So far, it has not been effectively scanned by human eye. In the galactic bulge, the survey was extended from its standard ±5 degrees of galactic latitude covered to |b| = 10°. The survey has an angular resolution of ~0.21 arcsec/pixel, which is well matched to the natural seeing (often approaching 0.5 arcsec). This higher resolution southern survey, which includes the rich galactic bulge region, provides a great opportunity to hunt for small resolved PNe hidden behind the dense star field towards the galactic centre. To utilise the data in a more efficient, objective, and consistent way, we constructed a deep learning object detection algorithm for PNe based on the novel Swin-Transformer model (Liu et al. 2021). For details see Sun et al. (2024). This datadriven method was adjusted according to the diverse properties of PNe, trained with 1137 individual images from IPHAS and the corresponding catalogue from the HASH database1 (Parker et al. 2016; Parker 2022). The dataset was then validated with a further 454 PNe images.
The validation results include the successful detection of 97.8% of all known PNe. Of the detected targets, 96.5% are real in HASH, which showed very decent performance for our model. Previous machine learning and deep learning studies in PNe research are not abundant; nevertheless, they reflect the evolution of neural network technology in different periods. For instance, Faundez-Abans et al. (1996) used a hierarchical cluster analysis and supervised artificial neural network (ANN) to classify PNe according to their chemical composition (i.e. based on spectroscopy), whereas Akras et al. (2019) used a decision tree model to find compact PNe in infrared photometric data. Most recently, Awang Iskandar et al. (2020) applied multiple deep neural network (DNN) models to several infrared and optical image datasets to distinguish PNe from all the types of nonPNe, and classify their morphologies with a certain measure of success.
This paper is organised as follows. The spectral observations and reduction process are described in Section 2, the results are presented in Section 3 in several categories, and the conclusions are given in Section 4.
2 Spectrum observation and reduction
The spectra of PNe have many strong, characteristic emission lines across the electromagnetic spectrum, although most available spectra are in the optical. We conducted spectral confirmation for a high quality, AI/ML discovered sample of PNe candidates. Our observations were performed between Jun. 13th and 21st, 2023, on the 1.9 m SAAO telescope using the SpUpNIC spectrograph (Crause et al. 2016) under the RUN #484. We used a grating of gr7 (300 lines per mm, blaze of 4600 Å, range of 5550 Å, dispersion of 2.72 Å/pixel) and we typically used a slit width 17 (~2 arcseconds). We adjusted exposure times according to the brightness of the targets, typically 300 s for brighter, more compact PNe, 600 s for intermediate surface brightness candidates and 900 s for our fainter targets including some repeated 900 s for such very faint ones. For the specific target YP0900-4457 (described in detail later in this work), we observed both its compact and apparent nebula jet components parts, with exposure times of 300 s and 900 s.
We reduced the spectra with IRAF V2.17, 2021 (Tody 1986, 1993). We created a master bias with zerocombine task and then smoothed it with imsurfit task. For dome and sky flats, the master flats were created with the flatcombine task. The master dome flat was fitted with the response task, then the new sky flat was generated by the ccdproc task; finally, the residual slope was removed with illum task from the new sky flat and a ‘perfect flat’ was created by the imarith task, multiplying the fitted master dome flat by the final new sky flat. We were then able to correct for both bias and flat and trim the spectra with the ccdproc task on the spectra of all object, ARC and flux calibrator spectra.
After this data reduction process, we combined any repeated observation with the imcombine task and cleaned cosmic ray events (CRE) with the imedit task. The 1D spectra of targets and ARCs were then extracted from the 2 D spectra using the apall task after identifying the nebula region and sky regions (for sky subtraction). The wavelength calibration was conducted with the identify, reidentify, refspec, and dispcor tasks to determinate the dispersion solutions from the ARC calibration spectra taken for each target observation and assigned to the target spectra (as appropriate). Finally, the flux calibration was conducted with the standard, sensfunc, and calibrate tasks, for our targets using selected standard stars LTT4364 and LTT9239, observed on each night.
3 Results
We determined whether a target is a PN or another object type by holistically assessing key features, following the precepts summarised in Parker (2022) (see Fig. 11 and Sect. 12.2 of that paper). This includes whether the target appears as an emission object in narrow-band imaging (our ML/AI algorithm detects as many unknown emission objects as possible), whether the target exhibits conforms to typical PN morphological classifications. We adopted the HASH ERBIAS/sparm morphological classification scheme (Parker et al. 2006). We also assessed whether nebula emission lines of reasonable S/N in the candidate followup spectra align with characteristics specific of typical PN types and evolutionary stages. However, typical emission line ratios of certain nebulae can still be mistaken for PNe. It may sometimes be necessary to consider the equivalent width of the Hα line when making judgments (Stasińska et al. 2022). In the following sub-sections, we provide examples of how to determine the type of target in specific cases.
In summary, from the set of the 31 top-quality PNe candidates we were able to observe, we spectroscopically confirmed 16 as true, 2 as likely and 4 as possible PNe. We further identified 3 emission-line galaxies (here their redshifts are low enough that the [N II] and H-alpha lines were not shifted out of the VPHAS+ Hα narrow-band filter), 2 emission-line stars, 2 latetype stars, 1 possible SNR fragment, and 1 known emission blob in a star cluster. It is clear that all but the 2 late-type stars had real emission lines. The properties of these candidates are summarised in the Table 1 of the appendix, including common names, RA (J2000) & Dec (J2000), Galactic 1 & b, object status, angular diameters (arcseconds) and, morphology (if applicable). We note that the diameters of candidates were measured with the DS9 region function on VPHAS+ Hα images whose scale is the zscale. We provide examples for each category and included all of our images and spectra in the appendix.
3.1 True PNe
We spectroscopically confirmed 16 candidates as true PNe (accounting for 51.61% of the total sample). The assignment of the true ‘T’ class followed standard HASH procedures as outlined in Parker et al. (2016); Parker (2022) based on a holistic assessment of all available data for each object. The spectroscopic confirmation is certainly vital and based on the nature of the target’s emission lines. This includes the presence of Hα, [N II], [O III], [S II], and [O I] in red and the detection of He II (if present, this is strong proof of PNe nature), along with [O III] and Hβ in blue, with ratio’s that are typical for PNe. See Fig. 1 in the appendix for their VPHAS+ detected PNG images labelled with red boxes, and the SHS Hα-Rband quotient images, VPHAS+ Hα-Rband quotient images, and our confirmatory SAAO spectra with their spectral lines labelled.
Most of these PNe are either round or elliptical, although some appear bipolar, with a few others exhibiting more irregular shapes. YP0821-4253 (the first two lines of Fig. 1) is the northwestern part of a highly evolved bipolar nebula that appears to be fragmented, which we have further observed on every parts and will present in a separated paper. It is the largest target found in this work. YP1317-6513 (the third line of Fig. 1), YP1612-5209 and YP1759-2036 are bright targets with strong clear emission lines. YP1429-6214 (the fourth line of Fig. 1) is a true bipolar PN right behind a foreground star. Typical PN emission lines of Hα, [N II] and [O III] have been detected despite unavoidable contamination from the late-type star continuum of the assumed foreground star. YP1731-3011 (the last two lines of Fig. 1) is faint in the VPHAS+ detection image, but it shows an associated north-west jet and a possible southward emission bubble in the quotient images. Its 2D spectrum can be extracted into a central white dwarf component with deep and wide hydrogen absorption lines and a surrounding true PN spectrum. The Hα line of the former has a possible P Cygni profile.
The rest of the PNe are small and faint, one of which approaches the limits of human visual resolution. They are often hidden within dense stellar fields, with some even concealed behind multiple stars. The discovery and confirmation of these nebulae demonstrate the powerful detection and robust interference rejection capabilities of our model, given its ability to find true PNe in such environments.
3.2 Likely and possible PNe
In this spectroscopic observation, we also confirmed two likely ‘L’ PNe and four possible ‘P’ PNe, again assigned following our standard HASH precepts. This combined L and P PNe sample accounts for 19.35% of the total. These L and P PNe are shown in Figs. 2 and 3 of the appendix. These L and P classifications refer to objects that exhibit some standard PNe characteristics of nebular morphology and spectral features but may also exhibit other characteristics or uncertainties that introduce some doubt. Such objects may also possess some rare emission lines or line ratios atypical of PNe. Some are too faint to obtain spectra with sufficient signal-to-noise-ratios (S/Ns) to accurately establish their nature, thus leading to a L or P categorisation.
Most of these candidates are located within dense star fields and appear round or quasi-stellar. There is also one target (YP1028-5714, the first line of Fig. 2) that is affected by the interference of an extremely bright star. These objects are generally very faint and difficult to discern. Their detection in complex stellar-interference environments showcases our model’s strong performance.
3.3 Other types of emission-line sources or mimics
Despite being trained on a core population of known PNe, our AI/ML algorithm is still able to identify all kinds of Hα emitters in narrow-band images, regardless of whether they are PNe or compact HII regions, Wolf-Rayet shells, detached components of supernova remnants, stromgren zones, emission-line stars, or even low-redshift emission-line galaxies whose Hα lines fall within the filter bandpass. Therefore, we may need to further refine the precise classification of targets through subsequent mult-wavelength image inspections and spectroscopic observations. Hence, our sample also includes a small number of other types of celestial objects.
Redshift and estimated distance of the three emission-line galaxies from spectral measurement.
3.3.1 Emission-line galaxies
We uncovered three narrow-line emission line galaxies in this work (see Fig. 4 in the appendix and Table 1) via the observed 30–50 Å redshifts exhibited by the emission lines (also typically seen in PNe) in their spectra. One of the sources, YP0827-3033, with Z=0.0062 is very compact, while YP1151-6247 (see the second line of Fig. 2), with Z=0.00414, appears as two slightly separated oval emission blobs. It was initially considered to be a bi-polar PN but is now likely to acutually be two interacting galaxies. Interestingly, the [N II]/Hα ratio is 8.6. The third example is YP1701-2519, a small but clearly resolved emission region, with Z=0.0059. The ability of the VPHAS+ survey to be sensitive to emission line galaxies depends on the filter bandpass and the redshift of the emission line galaxy. The filter has central wavelength and FWHM of 6588 and 107 Å, respectively (Drew et al. 2005).
3.3.2 Emission-line stars and late-type stars
As part of our sample verification strategy we selected a series of compact, apparently unresolved sources for observation that appeared to have obvious Hα emission given the disparity in intensity between the Hα image and the broad-band red equivalent. These were suspected of being either emission-line stars or perhaps late-type star contaminants. This selection was done blindly from the AI/ML provided VPHAS+ target lists without reference to other imagery (which could have been indicative of likely source type). Spectral analysis of these selected cases revealed that two (6.45% of the total) were indeed late-type stars dominated by strong molecular bands (see Fig. 6 in the appendix). As described in Parker et al. (2006), these arise because of how the molecular band distribution falls within the Hα filter bandpass, while simultaneously increasing in strength of peak intensity as we move further to the red. These stars get selected by the Hα filter, whereas the band influence is diluted by their inclusion in the broad-band red-filter. The apparent image shape of YP1705-2524 (one of these late type star contaminants) is slightly elongated due to the presence of another relatively faint star nearby. Two emission line (EM) stars were also found, again accounting for 6.45% of the total (see Fig. 5 in the appendix). One of the EM stars (YP0900-4457, the third and fourth lines of Fig. 2) is located in a sparsely populated stellar field region, indicating a strong absorption screen behind the stars that are visible. The spectrum exhibits multiple very strong emission lines with an nebular outflow to the north. A spectrum of this outflow was also taken which has a very similar spectrum to that of the assumed host star. However, there is another possibility that our spectroscopic observation missed the outflow and instead captured the edge of the star, which requires further examination. Both emission line stars discovered show Ca II triplet lines in the infrared in emission. These results show that selection of these types of apparent emitter could provide a rich vein of faint emission lines stars for further study – more examples are needed to statistically establish the true emission versus late-type star fractions, which here are nominally 50% each.
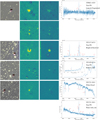 |
Fig. 1 Selected true PNe target examples: VPHAS+ detected PNG images labelled with red boxes; SHS Hα-Rband quotient images; VPHAS+ Hα-Rband quotient images, and SAAO spectra are shown with their spectral lines labelled. |
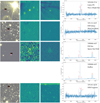 |
Fig. 2 Selected likely and possible PNe, emission-line galaxies and other target examples: VPHAS+ detected PNG images labelled with red boxes; SHS Hα-Rband quotient images; VPHAS+ Hα-Rband quotient images, and SAAO spectra are shown with their spectral lines labelled. |
3.3.3 Others
In this spectroscopic observation, we also identified two other targets, accounting for 6.45% of the total (see Fig. 7 in the appendix).
One of them turns out to be a small detached fragment of the famous supernova remnant RCW 86 (YP1441-6239, the last line of Fig. 2). Our AI network detected multiple similar targets and the exclusion of them from our PNe searching requires much larger-scale surrounding images for judgment.
The other remaining observed target independently identified turns out to be a known Hα emission object located within the super star cluster Westerlund 1. It has been previously studied using VPHAS+, HST, and VLT data, for instance, by Wright et al. (2014), and identified as an ionised hydrogen gas cloud surrounding a red super-giant.
4 Conclusions
We present the first discovery and confirmation of PNe candidates found from deep learning techniques applied to highresolution VPHAS+ survey data. We have proven our techniques are able to independently and automatically uncover faint, resolved PNe in very dense star fields near the Galactic centre using the high-resolution Hα survey VPHAS+. These targets are often beyond the reach of traditional detection software and often visual scrutiny. Our automated techniques, once they have been trained as described in Paper I, save on the significant manpower required of eye-inspection applied tothe large imaging survey datasets. To achieve these very encouraging results we developed a novel Swin-Transformer algorithm (see Sun et al. 2024) with an IPHAS training sample based on the existing inventory of PNe curated within the HASH PNe database (Parker et al. 2016). We found more than 800 high-quality candidates and selected 31 of them for initial spectral observation at SAAO. We spectroscopically confirmed that 22 are true (T), likely (L) and possible (P) PNe giving a formal confirmation level of 70.97%. These PNe are mostly very faint and located in dense fields, with several directly partially obscured behind stars or under the glow/interference of a very bright nearby stars. We also found a CSPN white dwarf with an interesting Hα jet. Of the remaining nine sources, seven were emission line sources, comprising three emission line galaxies, two emission lines stars, a component of a supernova and an emission blob in a star cluster. Only 2 out of 31 objects were non-emitters, having been classed as latetype stars with string red molecular bands. This gives an overall success rate of 29 out of 31 (or 93.5%) for detecting emission sources of all types.
In the future, we will continue working on the other half of VPHAS+ fields, stacking them for fainter nebulae. We will also look to further improve searching techniques based on the fusion of all available wavebands. In addition, a pixel-to-pixel Hα nebulae map is also planned for a more complete search for faint PNe and other kinds of nebulae.
Data availability
The table of parameters of the observed PN candidates and any associated nebulosity or outflows, the appendices of VPHAS+ detected PNG images labelled by red boxes, SHS Hα-Rband quotient images, VPHAS+ Hα-Rband quotient images, SAAO spectra with spectral lines labelled, and the reduced spectra in this paper can be accessed from https://doi.org/10.5281/zenodo.13945269.
Acknowledgements
Q.A.P. thanks the Hong Kong Research Grants Council for GRF research support under grants 17326116 and 17300417. Y.L. thanks HKU and QAP for provision of a PhD scholarship from RMGS funds awarded to the LSR. This work is also supported by National Natural Science Foundation of China (NSFC) with funding number of 12303105, 12173027 and 12173062 and Civil Aerospace Technology Research Project (D050105). We acknowledge the science research grants from the China Manned Space Project with NO. CMS-CSST-2021-A01 and science research grants from the Square Kilometre Array (SKA) Project with NO. 2020SKA0110102. We thank the SAAO for observing time.
References
- Akras, S., Guzman-Ramirez, L., & Gonçalves, D. R. 2019, MNRAS, 488, 3238 [NASA ADS] [CrossRef] [Google Scholar]
- Awang Iskandar, D. N. F., Zijlstra, A. A., McDonald, I., et al. 2020, Galaxies, 8, 88 [NASA ADS] [CrossRef] [Google Scholar]
- Badenes, C., Maoz, D., & Ciardullo, R. 2015, ApJ, 804, L25 [NASA ADS] [CrossRef] [Google Scholar]
- Crause, L. A., Carter, D., Daniels, A., et al. 2016, Proc. SPIE, 9908, 990827 [NASA ADS] [CrossRef] [Google Scholar]
- Drew, J. E., Greimel, R., Irwin, M. J., et al. 2005, MNRAS, 362, 753 [NASA ADS] [CrossRef] [Google Scholar]
- Drew, J. E., Gonzalez-Solares, E., Greimel, R., et al. 2014, MNRAS, 440, 2036 [Google Scholar]
- Faundez-Abans, M., Ormeno, M. I., & de Oliveira-Abans, M. 1996, A&AS, 116, 395 [NASA ADS] [CrossRef] [EDP Sciences] [Google Scholar]
- Fragkou, V., Parker, Q. A., Zijlstra, A. A., et al. 2022, ApJ, 935, L35 [NASA ADS] [CrossRef] [Google Scholar]
- Frew, D. J., & Parker, Q. A. 2010, PASA, 27, 129 [CrossRef] [Google Scholar]
- Henry, R. B. C., Kwitter, K. B., Jaskot, A. E., et al. 2010, ApJ, 724, 748 [NASA ADS] [CrossRef] [Google Scholar]
- Iben, I. 1995, Phys. Rep., 250, 2 [NASA ADS] [CrossRef] [Google Scholar]
- Jacob, R., Schönberner, D., & Steffen, M. 2013, A&A, 558, A78 [NASA ADS] [CrossRef] [EDP Sciences] [Google Scholar]
- Liu, Z., Lin, Y., Cao, Y., et al. 2021, arXiv e-prints [arXiv:2103.14030] [Google Scholar]
- Maciel, W. J., Costa, R. D. D., & Uchida, M. M. M. 2003, A&A, 397, 667 [NASA ADS] [CrossRef] [EDP Sciences] [Google Scholar]
- Maciel, W. J., Costa, R. D. D., & Cavichia, O. 2015, Rev. Mexicana Astron. Astrofis., 51, 165 [Google Scholar]
- Miszalski, B., Parker, Q. A., Acker, A., et al. 2008, MNRAS, 384, 525 [NASA ADS] [CrossRef] [Google Scholar]
- Parker, Q. A., Phillipps, S., Pierce, M. J., et al. 2005, MNRAS, 362, 689 [NASA ADS] [CrossRef] [Google Scholar]
- Parker, Q. A., Acker, A., Frew, D. J., et al. 2006, MNRAS, 373, 79 [NASA ADS] [CrossRef] [Google Scholar]
- Parker, Q. A., Bojičić, I. S., & Frew, D. J. 2016, J. Phys. Conf. Ser., 728, 032008 [NASA ADS] [CrossRef] [Google Scholar]
- Parker, Q. A. 2022, Front. Astron. Space Sci., 9, 895287 [NASA ADS] [CrossRef] [Google Scholar]
- Sabin, L., Parker, Q. A., Corradi, R. L. M., et al. 2014, MNRAS, 443, 3388 [NASA ADS] [CrossRef] [Google Scholar]
- Sun, R., Li, Y., Parker, Q., et al. 2024, MNRAS, 528, 4733 [CrossRef] [Google Scholar]
- Stanghellini, L., & Haywood, M. 2018, ApJ, 862, 45 [Google Scholar]
- Stasińska, G., Trevisan, M., & Vale Asari, N. 2022, Front. Astron. Space Sci., 9, 913485 [CrossRef] [Google Scholar]
- Tody, D. 1986, Proc. SPIE, 627, 733 [NASA ADS] [CrossRef] [Google Scholar]
- Tody, D. 1993, Astron. Data Anal. Softw. Syst. II, 52, 173 [NASA ADS] [Google Scholar]
- Wright, N. J., Wesson, R., Drew, J. E., et al. 2014, MNRAS, 437, L1 [NASA ADS] [CrossRef] [Google Scholar]
HASH: online at http://www.hashpn.space. HASH federates available multi-wavelength imaging, spectroscopic and other data for all known Galactic and Magellanic Cloud PNe.
All Tables
Redshift and estimated distance of the three emission-line galaxies from spectral measurement.
All Figures
|
Fig. 1 Selected true PNe target examples: VPHAS+ detected PNG images labelled with red boxes; SHS Hα-Rband quotient images; VPHAS+ Hα-Rband quotient images, and SAAO spectra are shown with their spectral lines labelled. |
| In the text | |
|
Fig. 2 Selected likely and possible PNe, emission-line galaxies and other target examples: VPHAS+ detected PNG images labelled with red boxes; SHS Hα-Rband quotient images; VPHAS+ Hα-Rband quotient images, and SAAO spectra are shown with their spectral lines labelled. |
| In the text | |
Current usage metrics show cumulative count of Article Views (full-text article views including HTML views, PDF and ePub downloads, according to the available data) and Abstracts Views on Vision4Press platform.
Data correspond to usage on the plateform after 2015. The current usage metrics is available 48-96 hours after online publication and is updated daily on week days.
Initial download of the metrics may take a while.