Fig. 7.
Download original image
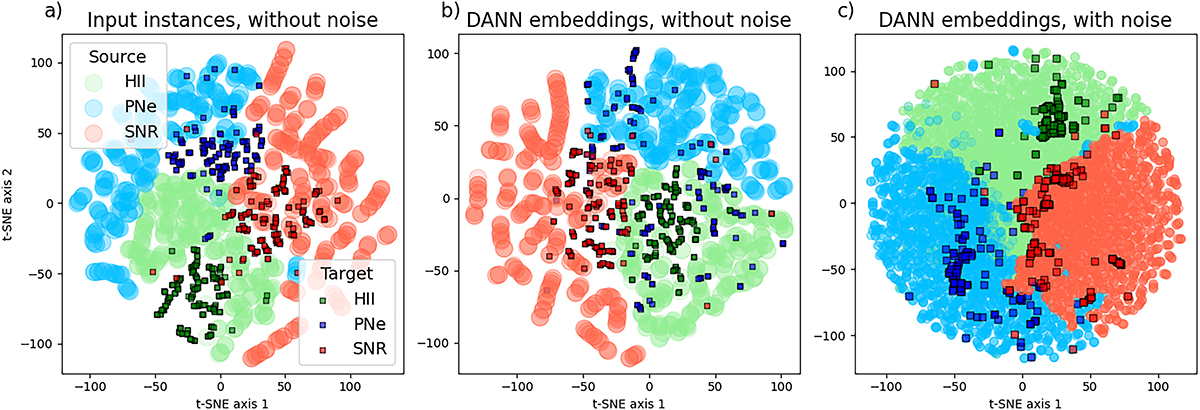
Two-dimensional representations of the input data and the embeddings from the DANN obtained using t-SNE, illustrating the distribution of instances from both the source and target domains. For ease of visualisation we plot only a random subset of the target domain that homogeneously populates the three classes. The quantities on the axes represent the output of t-SNE and do not have a physical meaning, and they represent a different projection in each panel. Light colours (light blue, light red, and light green) represent the three classes in the source domain (H II regions, PNe, and SNRs, respectively), while dark colours (dark blue, dark red, and dark green) represent the same three classes in the target domain. Left: Input vectors show a clear separation between the source and target domains, pointing to the presence of a domain shift. Middle: Embedding vectors from the DANN model show a closer alignment of instances, showcasing the effectiveness of DANN in reducing domain shift. Right: The alignment is further enhanced with noise augmentation in the training set. Dark-coloured outliers in source domain clusters reflect the imperfect accuracy of the DANN model. Their existence is reflected in the non-diagonal confusion matrices discussed in Sec. 4.1.
Current usage metrics show cumulative count of Article Views (full-text article views including HTML views, PDF and ePub downloads, according to the available data) and Abstracts Views on Vision4Press platform.
Data correspond to usage on the plateform after 2015. The current usage metrics is available 48-96 hours after online publication and is updated daily on week days.
Initial download of the metrics may take a while.