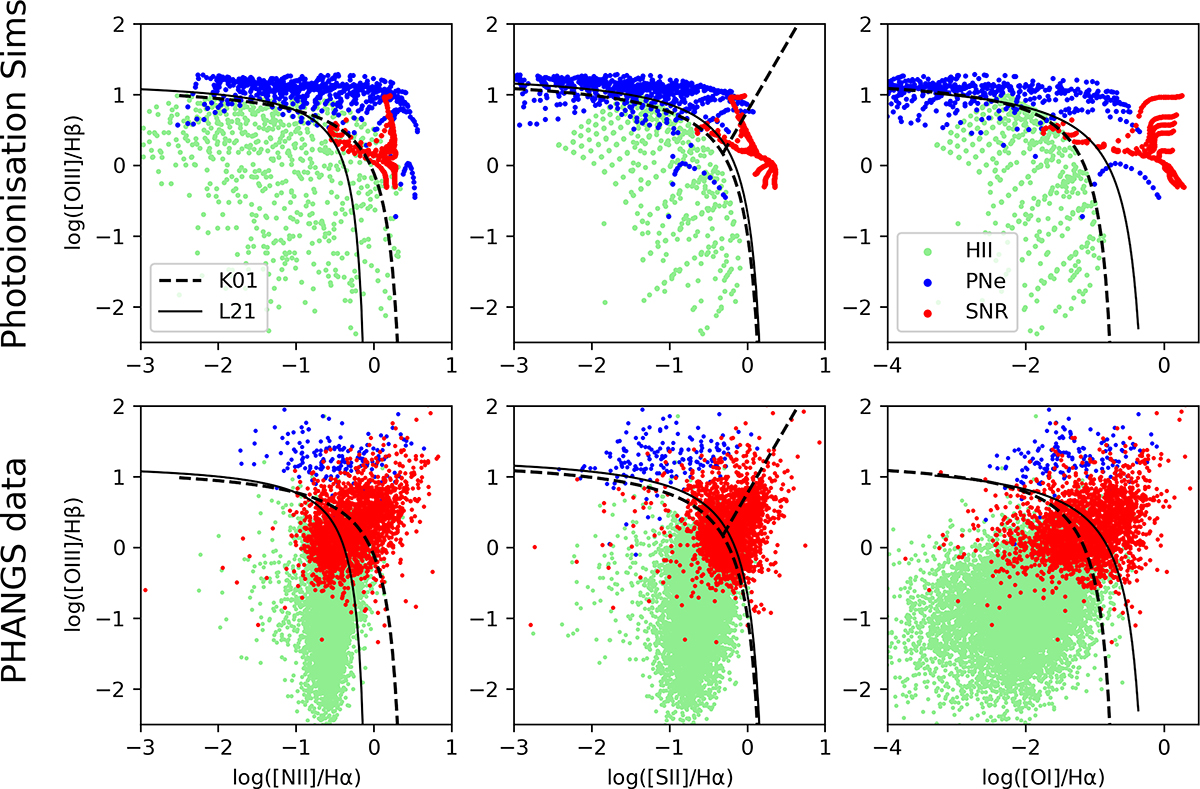
Fig. 2.
Download original image
Location in three BPT diagrams of photoionisation simulations (top row) and ionised nebulae from PHANGS-MUSE (C23, bottom row). In each panel, the colour-coding represents class labels (green: H II regions, blue: PNe, and red: SNRs). The class labels for the observed nebulae are based on the Bayesian methodology of C23 and are never used in the training, as we treat the target domain as unlabelled. Only the subset of the C23 catalogue used to train the classification algorithm presented in this work is shown. In each BPT diagram we show the demarcation lines of Law et al. (2021) (L21, solid line) and Kewley et al. (2001, 2006) (K01, dashed line). The Kauffmann et al. (2003) line in the [N II]-BPT is almost coincident with the Law et al. (2021) line. The figure demonstrates that there is only a limited overlap in parameter space between simulations and data.
Current usage metrics show cumulative count of Article Views (full-text article views including HTML views, PDF and ePub downloads, according to the available data) and Abstracts Views on Vision4Press platform.
Data correspond to usage on the plateform after 2015. The current usage metrics is available 48-96 hours after online publication and is updated daily on week days.
Initial download of the metrics may take a while.