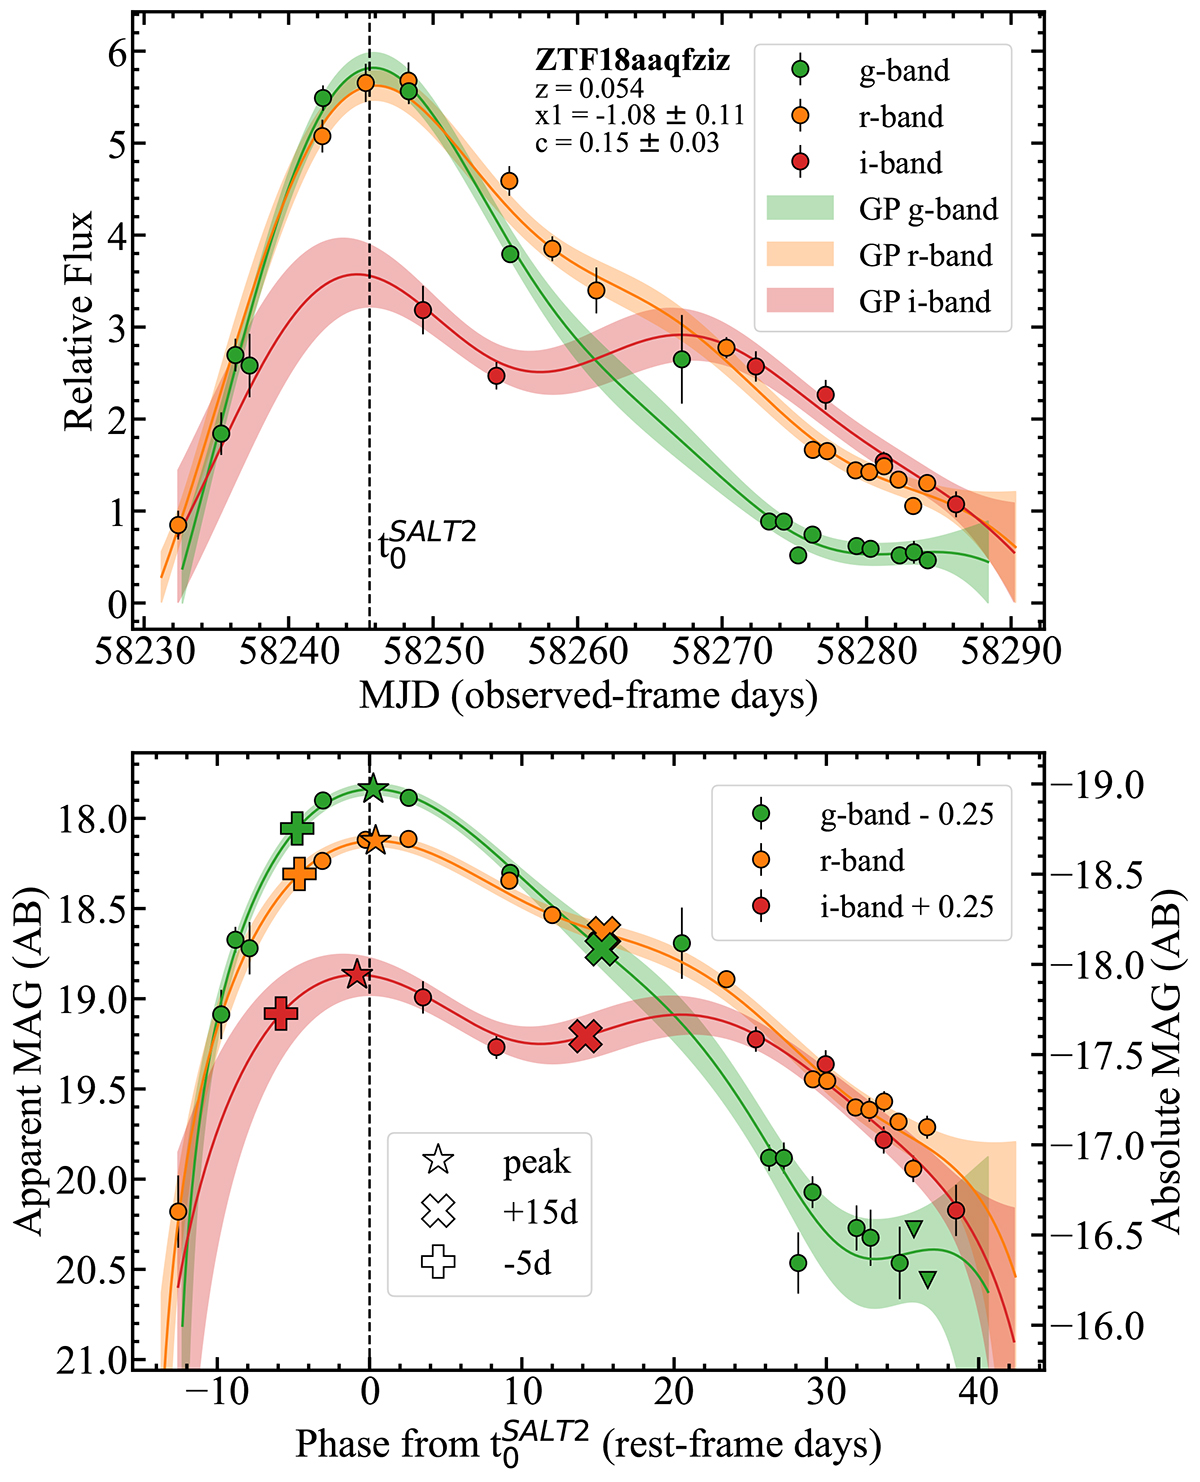
Fig. 4.
Download original image
Example of a GPs fit to the light curves of ZTF18aaqfziz (SN 2018bhp), a SN with average sampling (see Fig. 1 from Rigault et al. 2025a). Top: Light curves in flux space for g, r, and i-band, as a function of time (in observed days), colour-coded as described in the legend. The solid lines show the GP fits, as described in the text, with shaded regions displaying the 1σ uncertainty. The vertical dashed line marks the fitted SALT2 time of maximum luminosity in B-band. Bottom: Same light curves and GP fits as above, but in magnitude space (both apparent and absolute), with downward triangles marking non-detections. The symbols correspond to the estimated brightness in each photometric band at various phases (see legends).
Current usage metrics show cumulative count of Article Views (full-text article views including HTML views, PDF and ePub downloads, according to the available data) and Abstracts Views on Vision4Press platform.
Data correspond to usage on the plateform after 2015. The current usage metrics is available 48-96 hours after online publication and is updated daily on week days.
Initial download of the metrics may take a while.