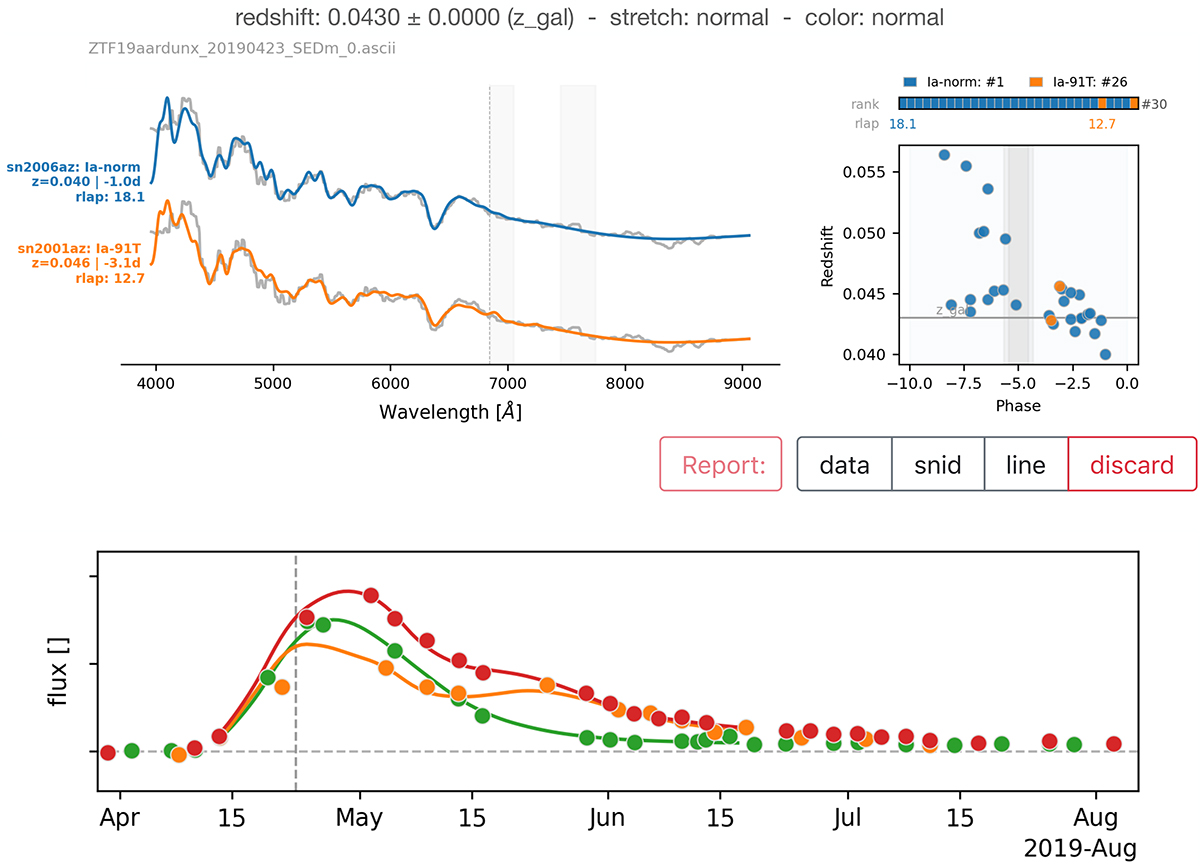
Fig. 1.
Download original image
Example of a typingapp webpage for ZTF19aardunx (SN 2019dpw), a typical SN Ia at z = 0.043. Its spectrum is fitted with SNID and (minimal) light curve fit information is displayed at the top of the figure. Top left: Target spectrum (in grey; the two curves are the same) overplotted with the best matching (rlap) entry (sub-)type template spectra, considering only the best 30 SNID entries (see top right panel). The vertical grey bands show the main telluric line locations. Top right: Summary of the SNID 30 best entries sorted by rlap. The lower panel shows the template matching redshift-phase correlations, while the top panel shows the entry (sub-)type sorting. The best rlap per (sub-)entry corresponding to the spectrum displayed on the left is shown. The grey vertical bands show the spectrum’s actual phase (±2σ) given the lightcurve’s t0 estimation. This target had five user classification inputs, three as snia-norm and two as snia, and thus it was automatically classified as a snia-norm. Bottom: Target light curve in g, r, and i band, shown as green, red, and orange circles, respectively, alongside the best fitted SALT2 model. The vertical dashed line corresponds to the date of the spectrum. The values and units of the transient’s flux are not displayed in order to avoid biasing the classifier.
Current usage metrics show cumulative count of Article Views (full-text article views including HTML views, PDF and ePub downloads, according to the available data) and Abstracts Views on Vision4Press platform.
Data correspond to usage on the plateform after 2015. The current usage metrics is available 48-96 hours after online publication and is updated daily on week days.
Initial download of the metrics may take a while.