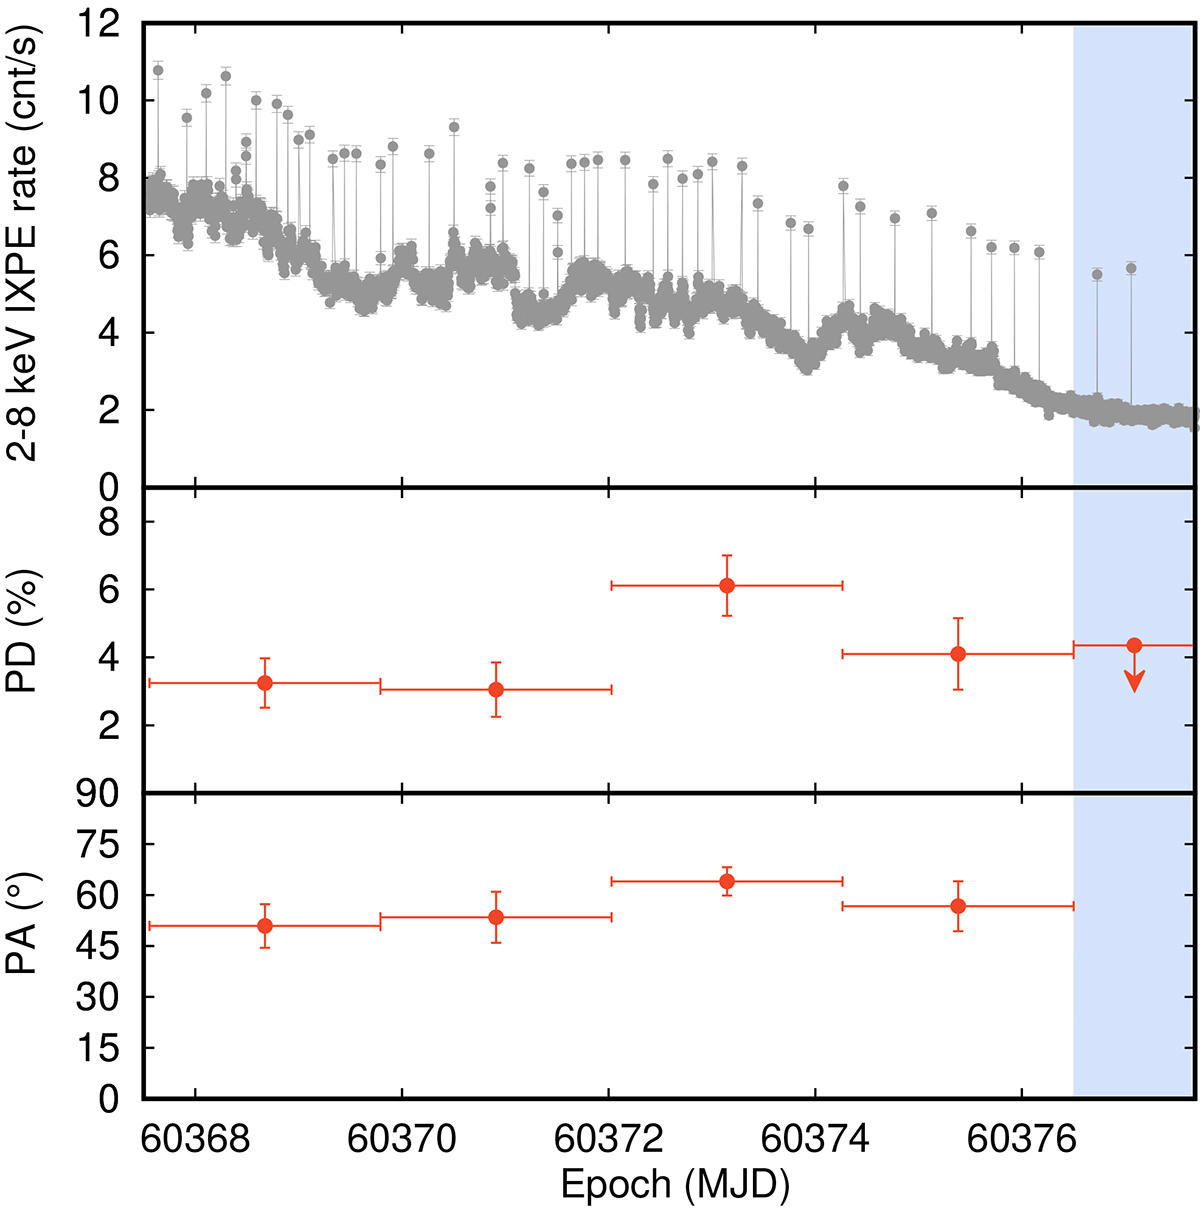
Fig. 2.
Download original image
IXPE 2–8 keV light curve in 200 s time bins (top panel). Type I X-ray bursts are easily recognized. PD (middle panel) and PA (bottom panel) of the total (i.e., persistent and bursting) emission measured in the 3–6 keV band and evaluated over ∼2 d long intervals. The blue shaded region indicates the interval after the increase in the pulse amplitude that was observed at MJD 60 376.5, in which a 90% c.l. upper limit on the PD is reported.
Current usage metrics show cumulative count of Article Views (full-text article views including HTML views, PDF and ePub downloads, according to the available data) and Abstracts Views on Vision4Press platform.
Data correspond to usage on the plateform after 2015. The current usage metrics is available 48-96 hours after online publication and is updated daily on week days.
Initial download of the metrics may take a while.