Fig. 4.
Download original image
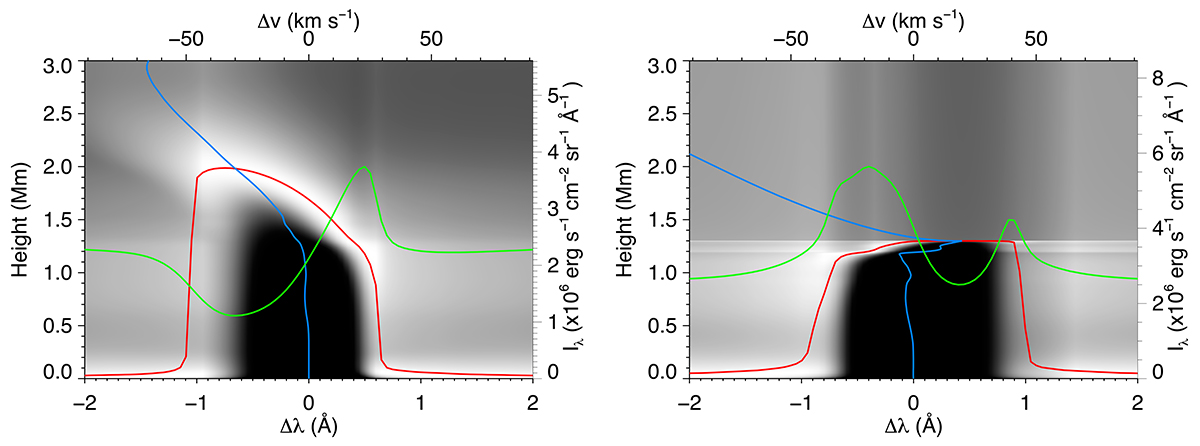
Line formation of Hα line at t = 30 s of single thread with Fpeak = 1 (left) and Fpeak = 10 (right). Lighter shades in the background denote larger values of the contribution function. The optical depth unity (red line) and the vertical velocity (blue line) as a function of height are overplotted, and the line profile is shown with a green line (right axis).
Current usage metrics show cumulative count of Article Views (full-text article views including HTML views, PDF and ePub downloads, according to the available data) and Abstracts Views on Vision4Press platform.
Data correspond to usage on the plateform after 2015. The current usage metrics is available 48-96 hours after online publication and is updated daily on week days.
Initial download of the metrics may take a while.