Open Access
Fig. 3.
Download original image
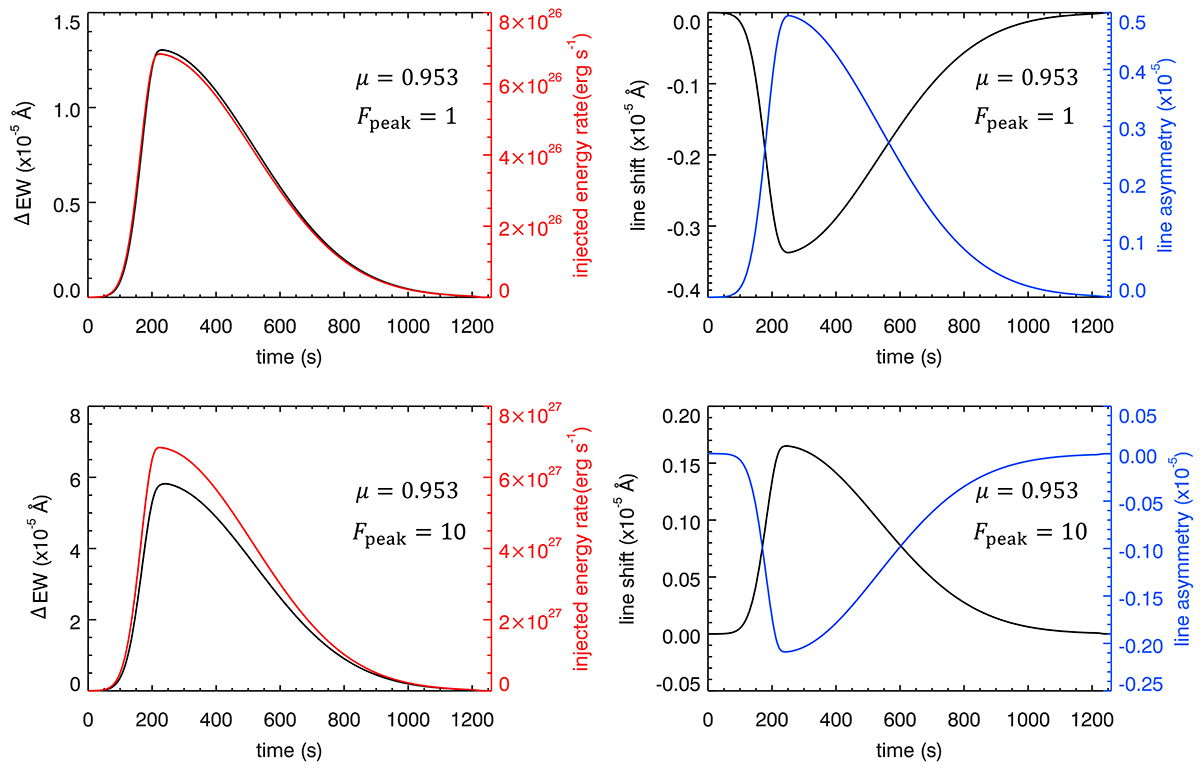
Quantities as functions of time. Left: Injected energy rate of nonthermal electron beam (red line) and equivalent width (black line). Right: Line shift measured from bisector method (black line) and red asymmetry calculated from Eq. (6) (blue line). Positive values represent redshift and red asymmetry.
Current usage metrics show cumulative count of Article Views (full-text article views including HTML views, PDF and ePub downloads, according to the available data) and Abstracts Views on Vision4Press platform.
Data correspond to usage on the plateform after 2015. The current usage metrics is available 48-96 hours after online publication and is updated daily on week days.
Initial download of the metrics may take a while.