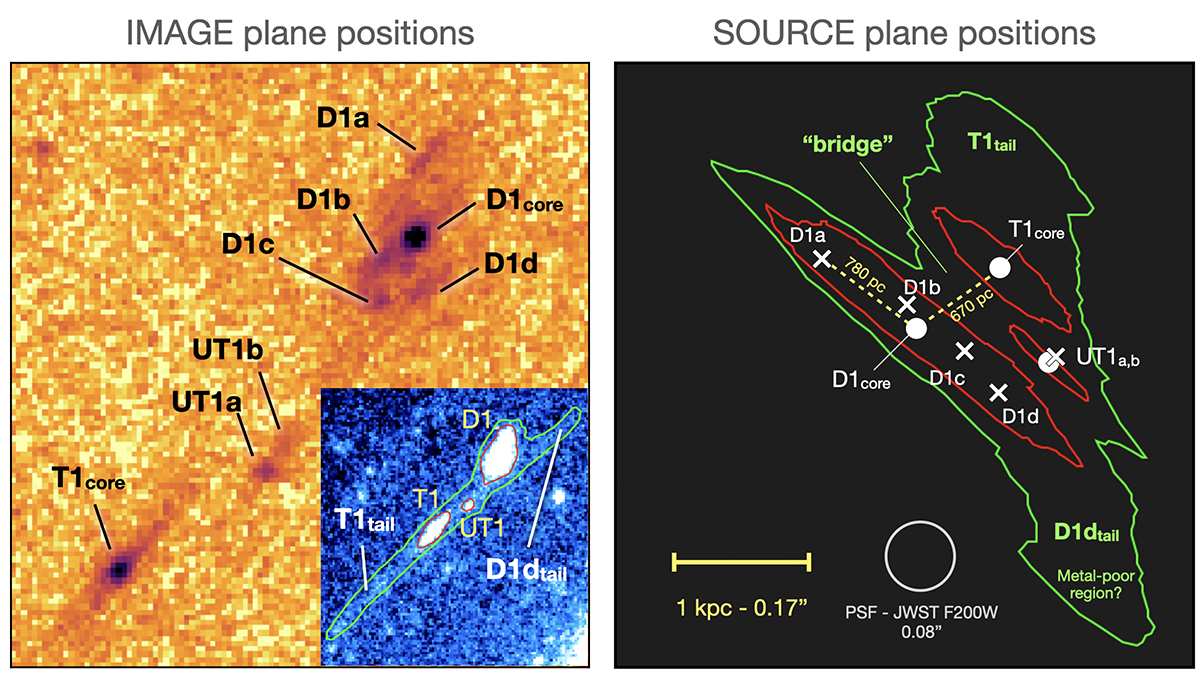
Fig. 3.
Download original image
Positions of sub-regions in the image and source planes. Left panel: Labels of the main rest-UV peaks and subregions of the D1-T1-UT1 systems on the stack of the SW filter observations. The inset shows a stacking of all filters where the three main regions (D1, T1 and UT1) are delimited by the red contours, while larger contours enclosing also the low surface-brightness emission are shown in green. Right panel: Mapping of the main and subregion positions on the source plane at z = 6.145 obtained from the best-fitting lens model by Bergamini et al. (2023). The compact cores (D1core, T1core and UT1a) are marked by white filled circles, while the other peaks of UV emission are marked by white “X” symbols. A 1 kpc (0.17″) reference scale is given in the top left corner. The FWHM of the F200W is also given as reference. The location of T1core coincides with the peak of the Lyα emission introduced in Sect. 1. The bridge region refers to the region of faint line emission discussed in Sect. 3.5.
Current usage metrics show cumulative count of Article Views (full-text article views including HTML views, PDF and ePub downloads, according to the available data) and Abstracts Views on Vision4Press platform.
Data correspond to usage on the plateform after 2015. The current usage metrics is available 48-96 hours after online publication and is updated daily on week days.
Initial download of the metrics may take a while.